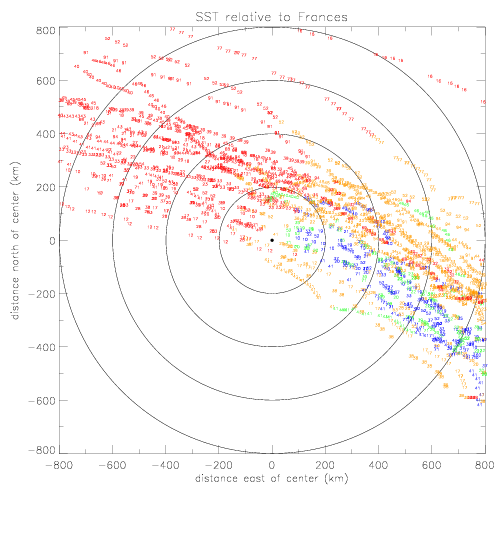
For the following figures, click on the images for enlarged versions of plots.


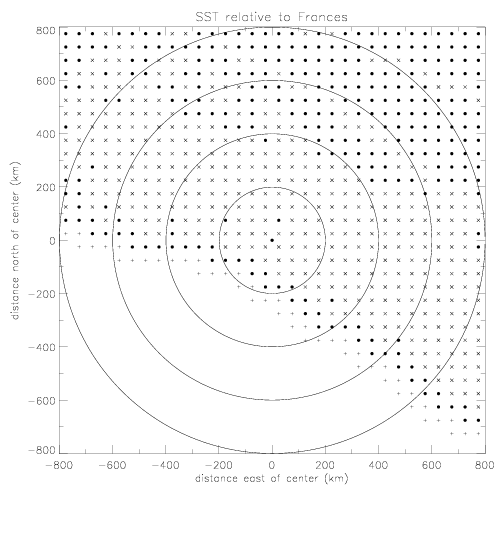
To generate a contour plot, all data are averaged on a 50x50km grid. In fig. 1.1.1(b) the gridcells with averages are marked with "x". Then points are filled in by averaging all surrounding 9 points (marked with solid dots). This step is repeated one more time, to create extra coverage in the south (marked with "+").
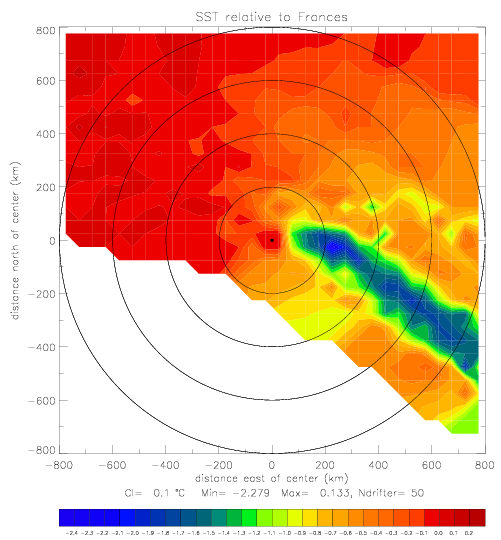
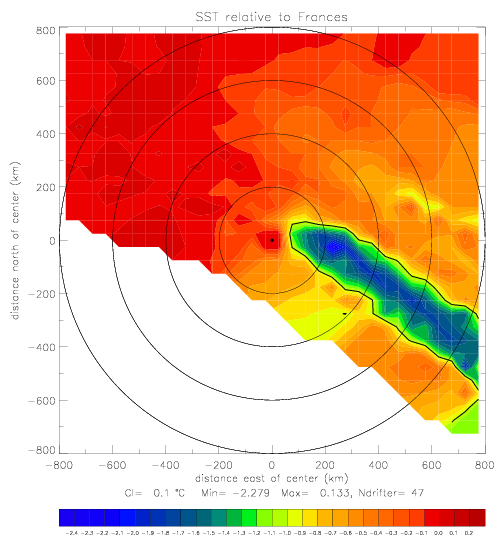
The contoured SST map is shown below. The figure on the left shows all drifters (fig. 1.1.2(a)). For the figure on the right, 3 drifters, which are the farthest from the hurricane array, are omitted: Metocean drifters 41540 and 41646 at (282° E,28° N), and SST drifter 41612 at (300° e, 20° N). The data from 30 drifters show a very well defined narrow wake of SST (ca. 200km wide), where the surface temperature has cooled up tp -2.5° C. The -1° C contour line is shown with a black line.
where p0 is the lowest pressure at the center (=940mb, from pressure plot), and pe is the pressure in undisturbed environment, or background pressure (=1020, from pressure plot).
The curve fits for Fabian and Isabel are shown below. The derived coefficients are: for Fabian (a=90.4, b=1.18), and for Isabel (a=30.7, b=0.96).
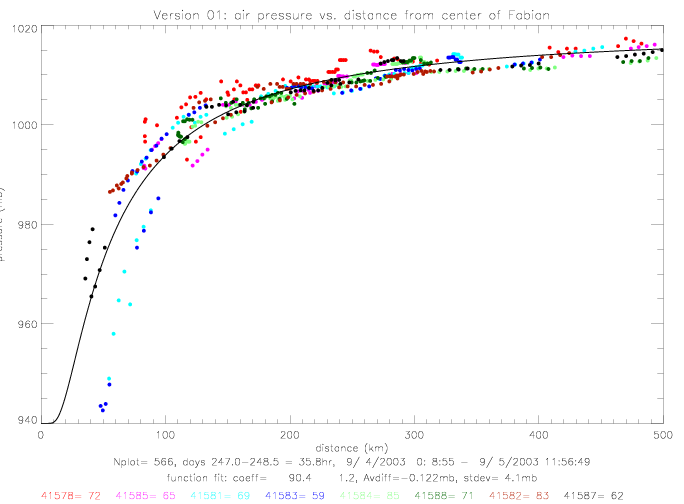
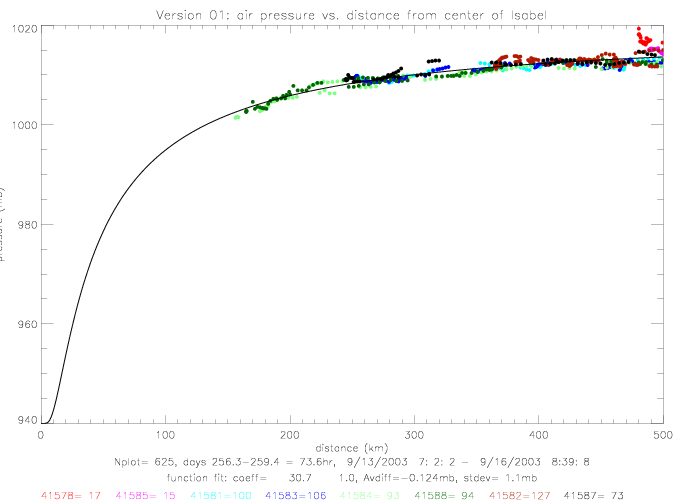
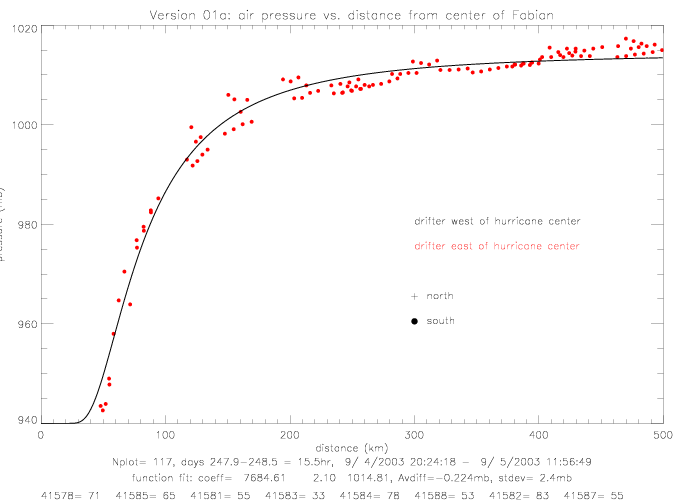
For Fabian, the low pressure values close to the hurricane center do not seem to follow a single line. An earlier plot by Bill Scuba seems to indicate a much tighter fit. These plots depend strongly on the accuracy of the position data: of the drifters, as well as the hurricane track. The next plot examnines these positions: NOAA's "best track" position fixes are shown with black squares (those positions are only available every 6hr), Bill's track positions are plotted in blue (maybe based on an early NOAA data file ??), and the splined NOAA positions are shown in red. The distance between drifters and the hurricane center are based on the splined positions. Also shown are the tracks of 3 drifters, with the location of the lowest pressure indicated, where the distance from drifter to hurricane center at that time is drawn. At the times of lowest measured pressure, drifters 41581 and 41583 (plotted in blue) and drifter 41578 (in black) are further away from the splined hurricane center position, than from Bill's track. Therefore, Bill's drifter plot shows a smaller distance at the time of minimum pressure than the splined data.
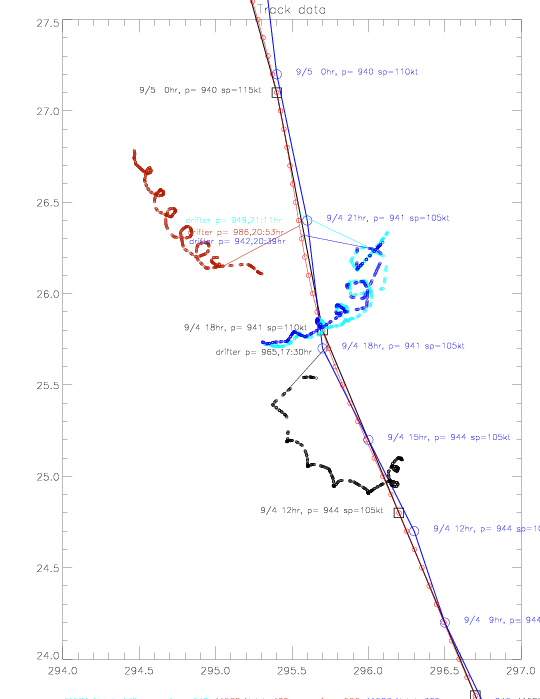
It is anow assumed that the splined hurricane center positions are correct. They are, however, only given every 6 hours, and are only available up to 1/10°. The accuracy of these "best track" position fixes is not known. It is also noteworthy, that drifters 41581 (light blue) and 41583 (dark blue) measured air pressure to the east of the hurricane center, and that the black drifter (41578) and brown drifter (41582) measured pressure to the west of the center. The previous pressure vs. distance plot can be re-drawn by marking data acoording to relative position to the hurricane center (north,south,east,west). This is shown in the next plot. The data to the southeast (red dots) follow a much tighter line than the entire data set.
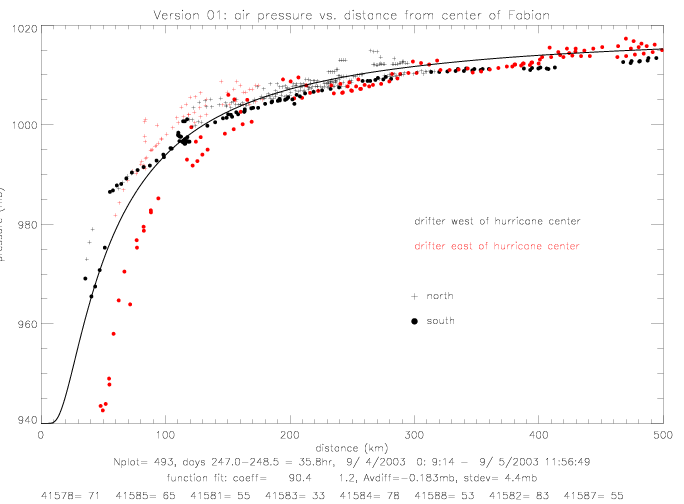
This plots indicates that pressure is much lower to the southeast of the center than to the northwest of the center. The functional fit for pressure (version 01a) from only the south-east quadrant is shown on the next plot.
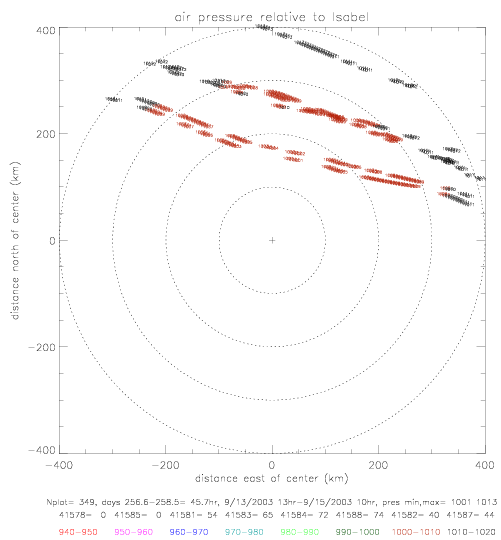
The next figures show pressure data plotted on a lon/lat map relative to the hurricane center. Pressure data are written on the plots, and colored according to magnitude: lowest values are in red, largest in black. On the last figure, the Fabian data has been contoured by hand, to emphasize the distribution of the data.
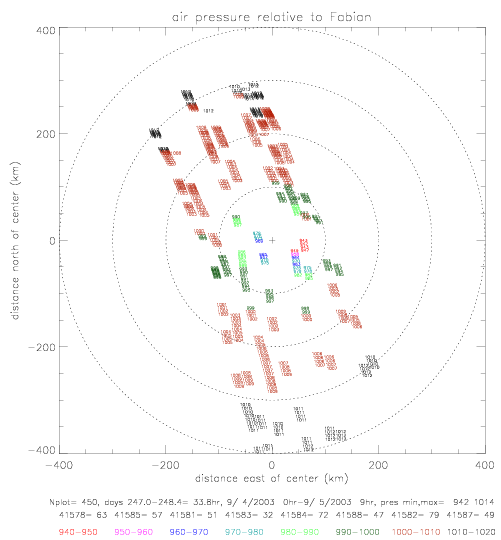
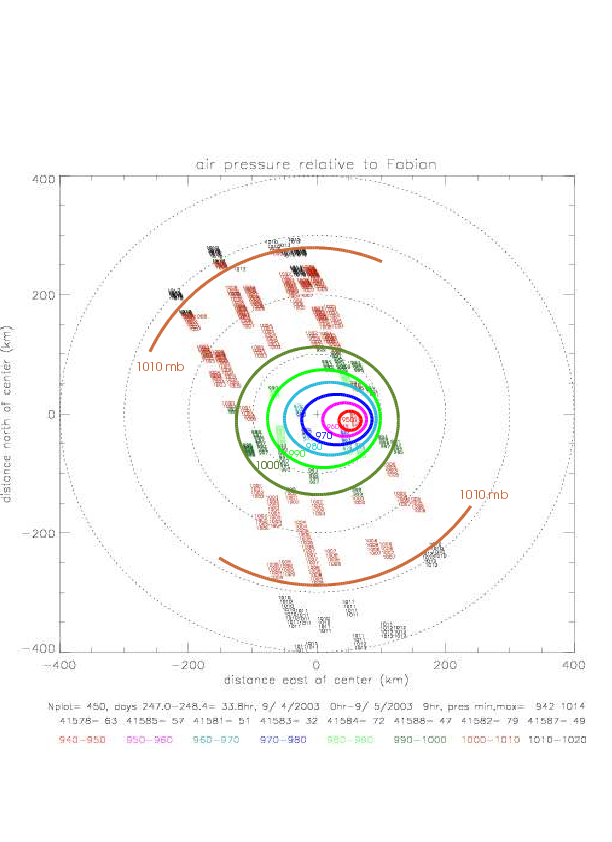
This plot indicates that the region of lowest pressure is found slightly to the south-east of the hurricane center.
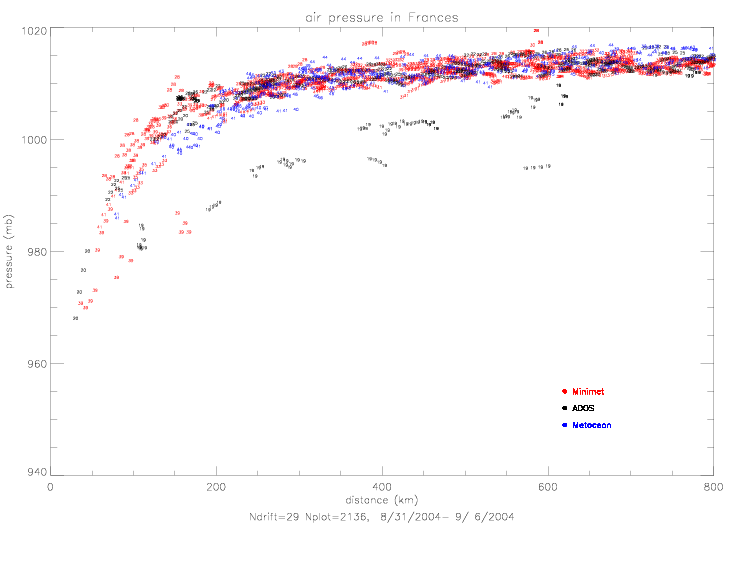
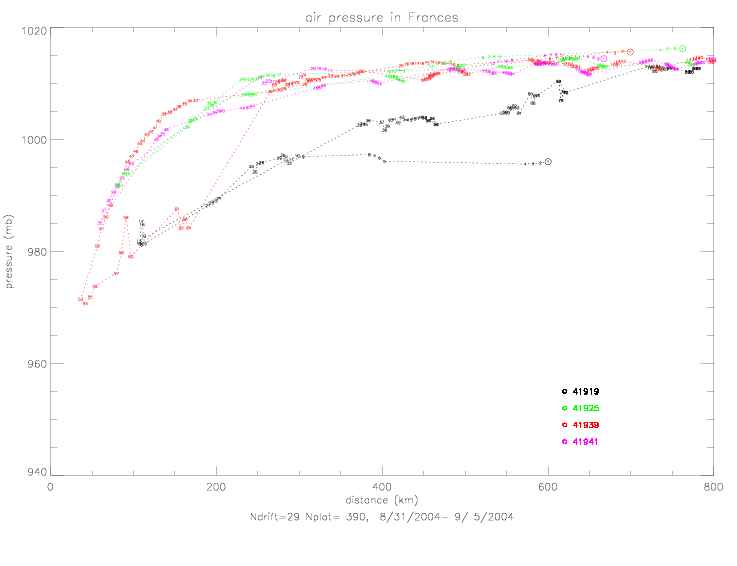
There are two drifters with distinctly lower pressure values than the entire group: ADOS 41919 and Minimet 41939. See also the figures of pressure vs. time (fig. 5.2.1(a) and fig. 5.3.7(a) of drifter observations during Frances and Jeanne). The next plot shows only their data with nearby drifters: 41919 with 41925, and 41939 with 41941. In this plot the data are numbered consecutively, and the first observation of each drifter is marked with an open circle. Drifter 41919 starts relatively low (995mb at 600km), remains about 15mb lower than all other drifters, but ends very near the other drifters with 1013mb at 770km. Drifter 41939 starts with values like all other drifters (1016mb at 700km) and reaches a minimum of 970mb at 40km (at 9/2 0:25). Then the pressure remains relatively low during the next 10 measurements for about 6 hours until 6:21 (985mb). The next measurement at 12:09 (1010mb at 270km) brings the data close to all other drifters. It is not known why these two drifters exhibit this behavior, but they will excluded from the following analysis.
The functional fits of air pressure vs. distance are based on the same function as was used for Fabian: pressure = f(dist) = p0 + (pe-p0) · e-(a/distb). In fig. 2.2.3(a) p0 is specified as 940mb, since the drifter data only goes down to 969mb at 30km. NOAA's "best track" pressure data shows a minimum of 937mb on 9/1/2004 12:00UTC. In the next two figures the data from the north-west quadrant are shown. When p0 is not specified, fig. 2.2.3(b), the fit differs by not more than 0.5mb from fig.(a) fit, which is drawn in this plot with a green dashed line. The pressure-fit coefficients for the sub-sample on fig. 2.2.3(a) are p0=940, pe=1019.15, a=34.18, and b=1.03. The sub-sample (coefficients shown in red in the subtitle) is based on data when for which the observed pressure is within 2 standard deviations of an initial fit of all data (coefficients shown in black in subtitle).
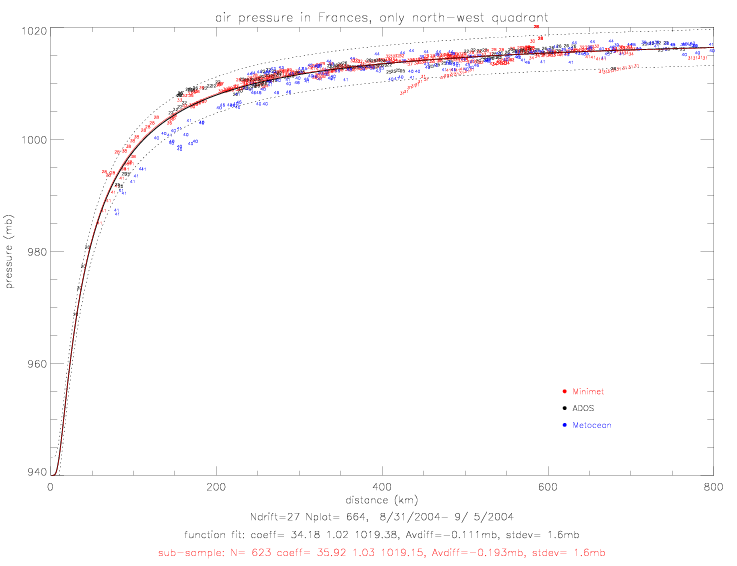
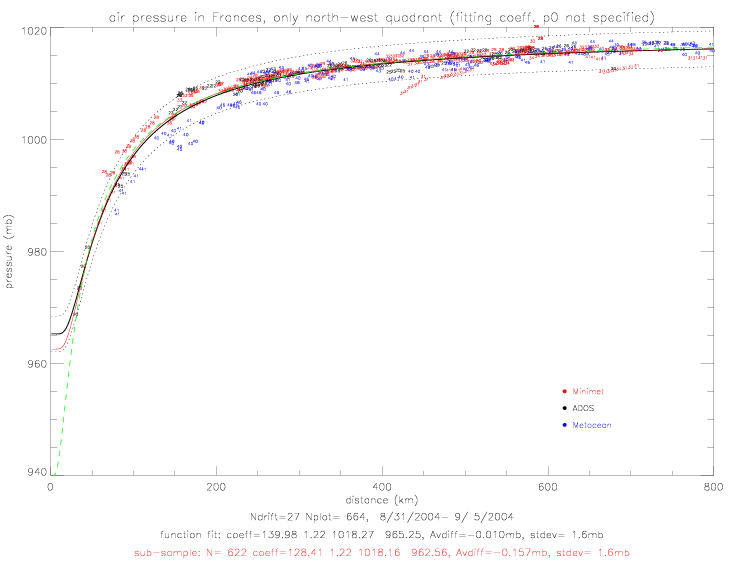
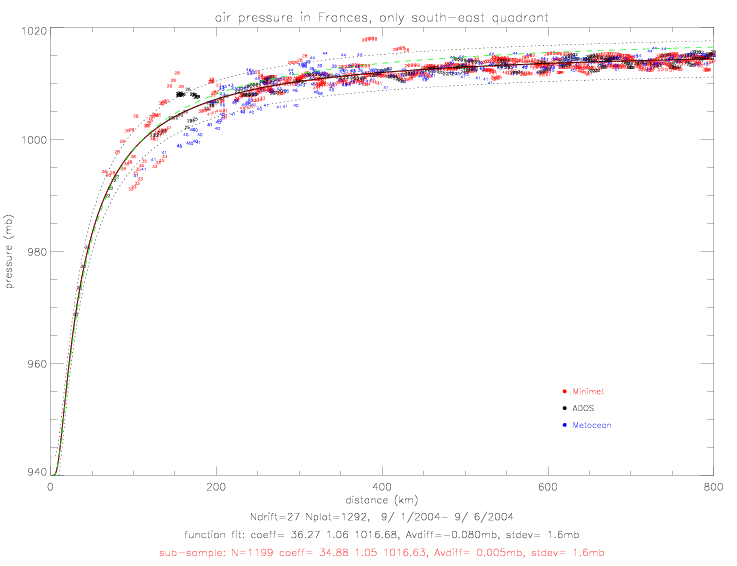
The fit for the south-east quadrant is presented below. Here the very lowest pressure observations are also included in the sample. The north-west fit is shown by the green dashed line: it is about 2mb above the south-east fit, and trends towards 1017mb at 800km, while the south-east data goes to 1015mb at 800km. The pressure fit coefficients for the sub-sample of south-east data are p0=940, pe=1016.93, a=34.88, and b=1.05.
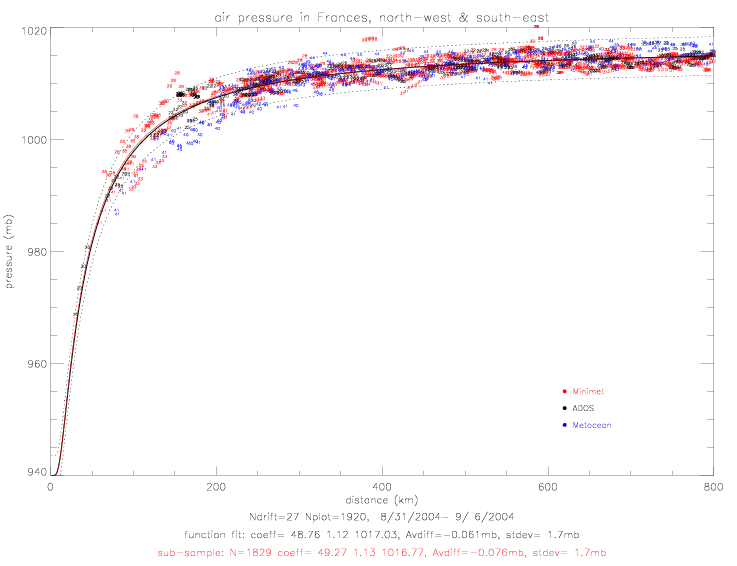
The fit for the combined north-west & south-east data is shown below. Here the best-fit coefficients are p0=940, pe=1016.77, a=49.27, and b=1.13.
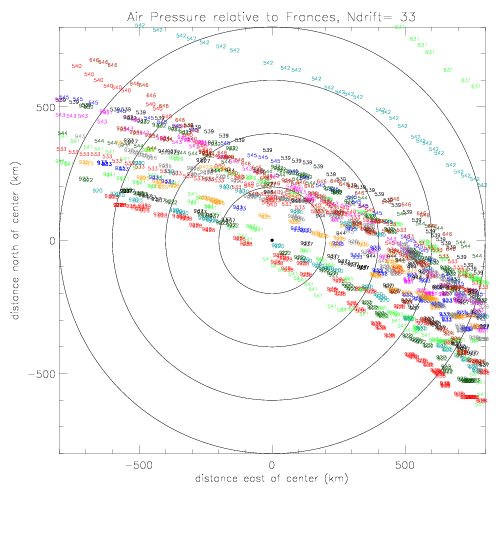
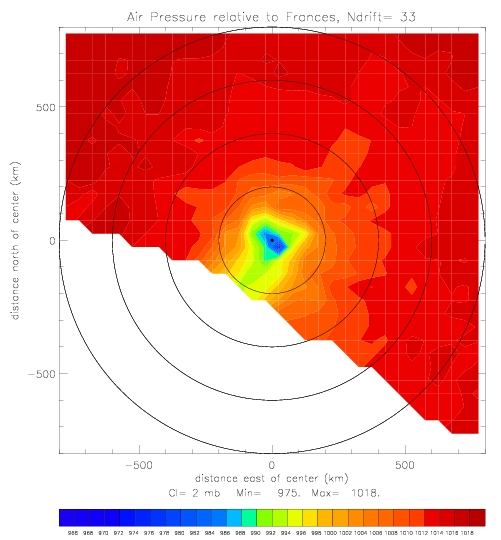
In the following figures, drifter observed air pressure is plotted relative to hurricane center as a two-dimensional map, during Frances.
All available drifters are used: 8 Metocean, 13 Minimet, 7 ADOS, 3 SVP, and 2 SST&pres; total = 33 drifters.
The first plot shows the data locations relative to hurricane center (fig. 2.1.1(a)).
Printed are the last 2 digits of the drifter ID. The plot color changes from drifter to another. The drifter pressure
data in these plots cover about 7 days, from 8/31 - 9/7/2004.
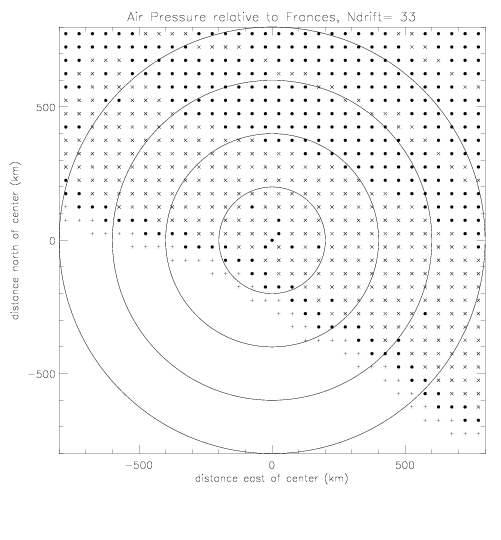
As in the SST figures, contour plots are generated by averaging all data on a 50x50km grid. In fig. 2.2.6(b) the grid cells with averages are marked with "x". Then points are filled in by averaging all surrounding 9 points (marked with solid dots). This step is repeated one more time, to create extra coverage in the south (marked with "+").
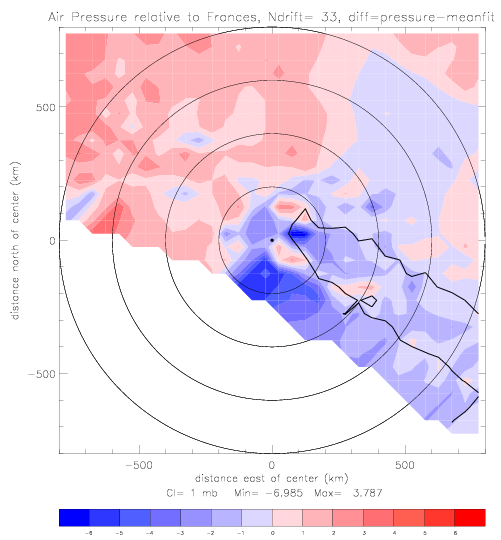
Contoured pressure maps are shown below. The figure on the left shows observed pressure (fig. 2.2.7(a)). For the figure on the right, the mean pressure from the pressure-to-distance fit has been subtracted: pressure = f(dist) = p0 + (pe-p0) · e-(a/distb), with coefficients as in fig. 2.2.5 . The ΔSST (-1°C) contour line is shown for comparison.
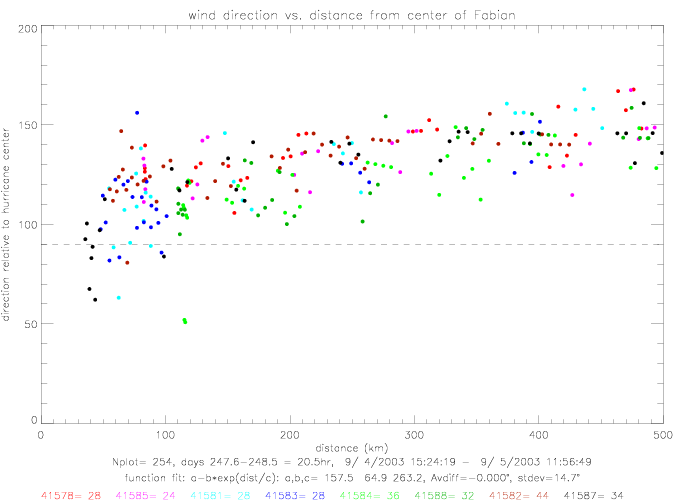
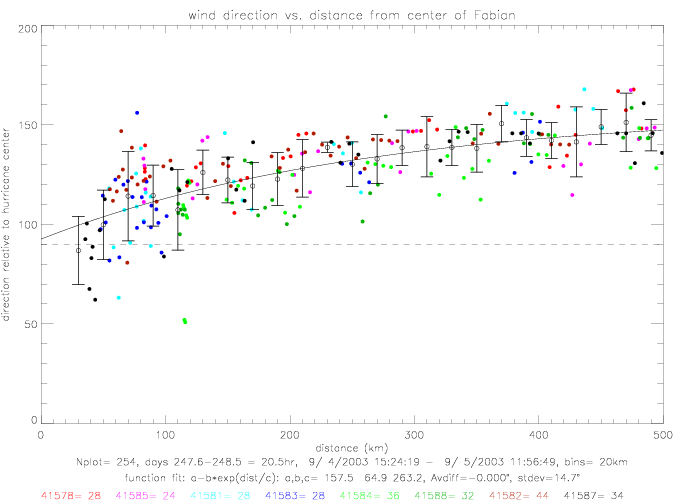
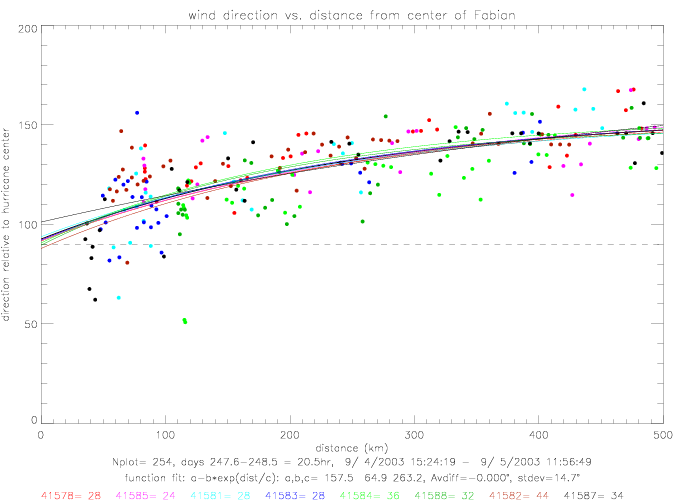
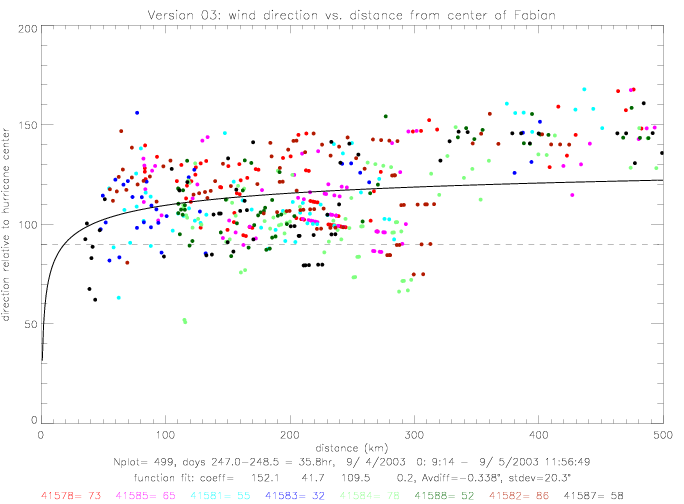
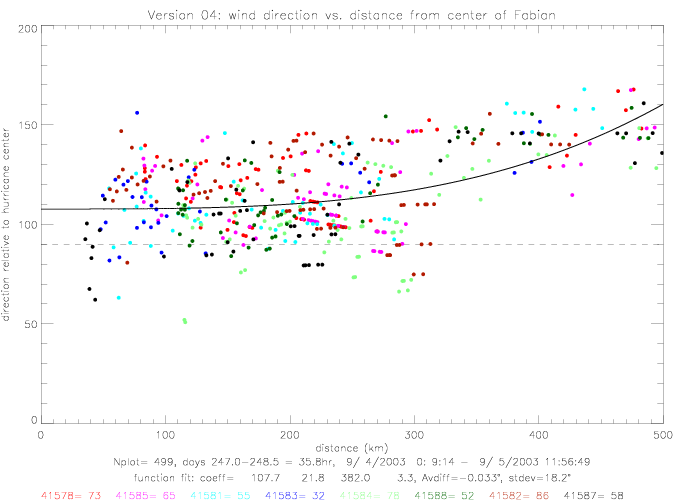
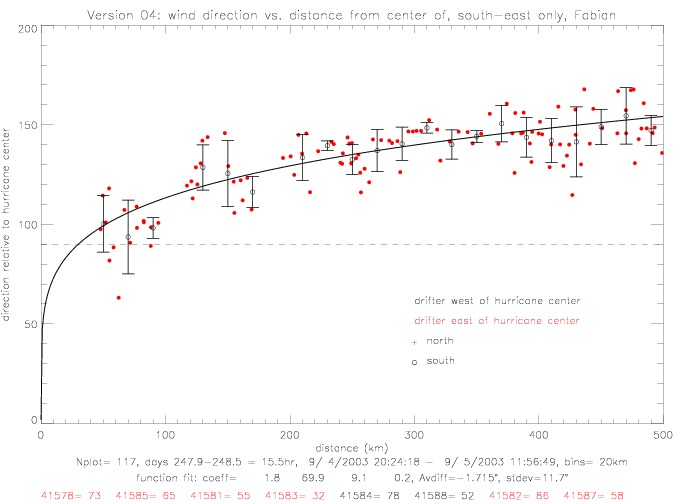
In the following figures, the "wind direction relative to hurricane center" is presented. An angle of 0° corresponds to wind blowing directly away from the huricane center with increasing angle in the counterclockwise direction. An angle of 90° comes from a radial wind, blowing counterclockwise around the hurricane center, and 180° is a wind blowing directly towards the center. Also shown are mean directions and standard deviations for 20km bins (0-20km, 20-40km, .., up to 480-500km). As an approximation to the functional behavior of wind vs. distance, the following formula is used, and the coefficients are determined by curve-fitting to the data:
When inlcuding all 8 drifters, the coefficients are determined to be a=157.5, b=64.9, and c=263.2. The difference between data and the fitted line has a standard deviation of 15°, as shown in the next figure.
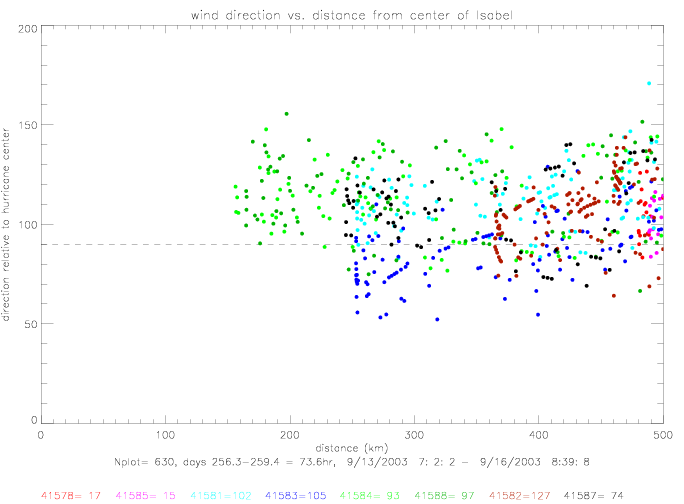
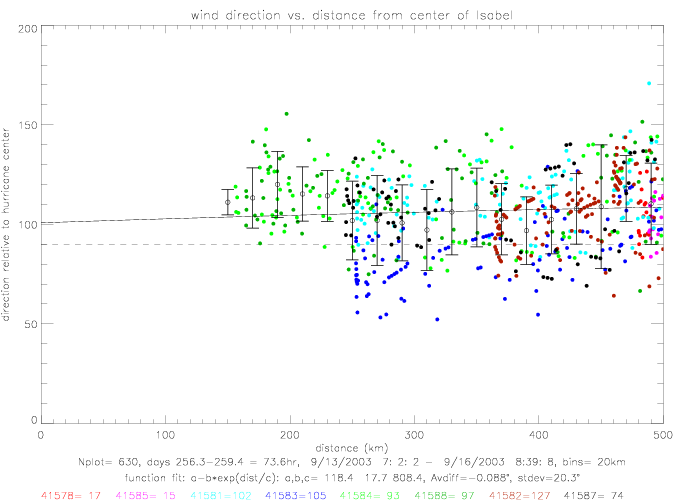
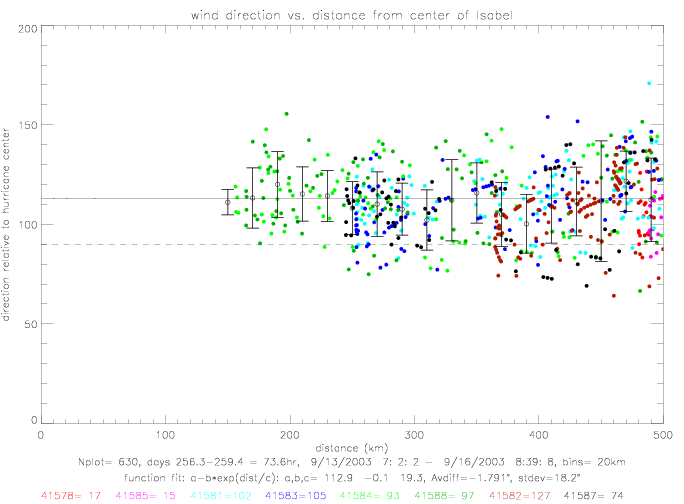
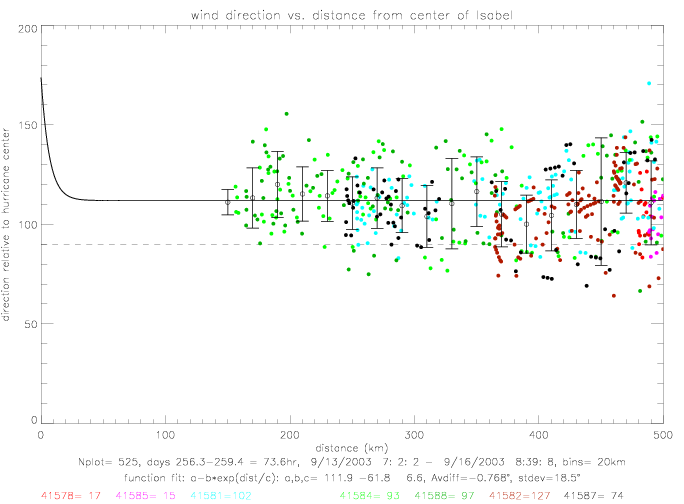
The same curve-fitting can be done for hurricane Isabel. During this hurricane, however, no drifter was closer than 150km. The data spread is much larger than during Fabian. Furthermore, when drifter 41583 gets corrected by 25°, or taken out of the sample, the derived functional fit changes substantially.
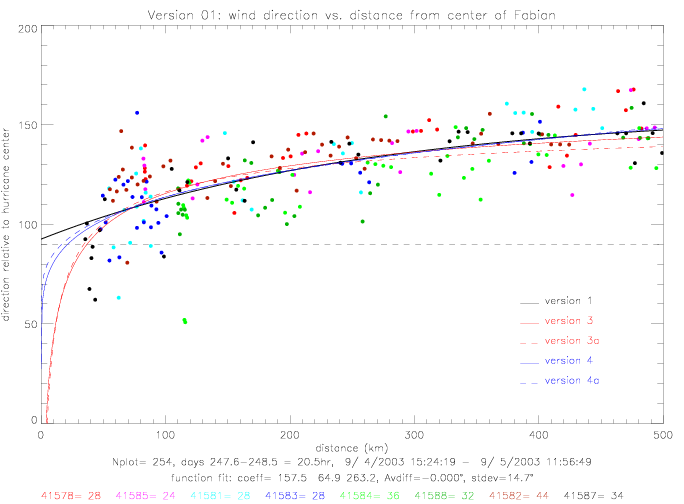
For Fabian, other functional fits can also be used. The following table summarizes results for four other functions, which are shown in the following figures. Versions "a" are defined by setting the denominator in (dist/c)**d to 100km; thereby reducing the number of unknown coefficients from 4 to 3.
| Version | Function | Coefficients a,b,c,d |
|---|---|---|
| 1 | dir = a - b * e**(dist/c) | 158, 65, 263 |
| 2 | dir = a + b / (dist/c)**d | does not converge |
| 3 | dir = a - b / (dist/c)**d | 194, 69, 160, 0.3 |
| 3a | dir = a - b / (dist/100)**c | 164, 48, ..., 0.4 |
| 4 | dir = a + b * (dist/c)**d | 27, 66, 28, 0.2 |
| 4a | dir = a + b * (dist/100)**c | 56, 58, ..., 0.3 |
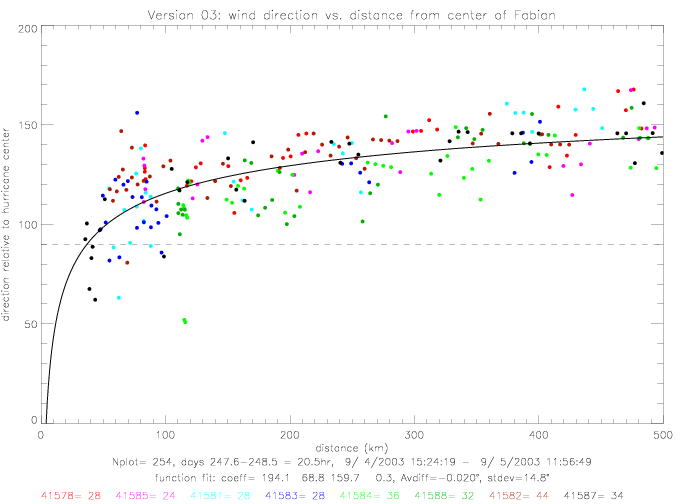
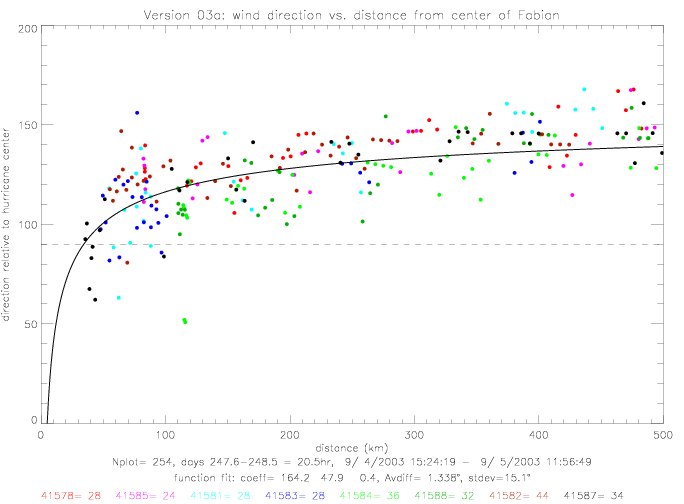
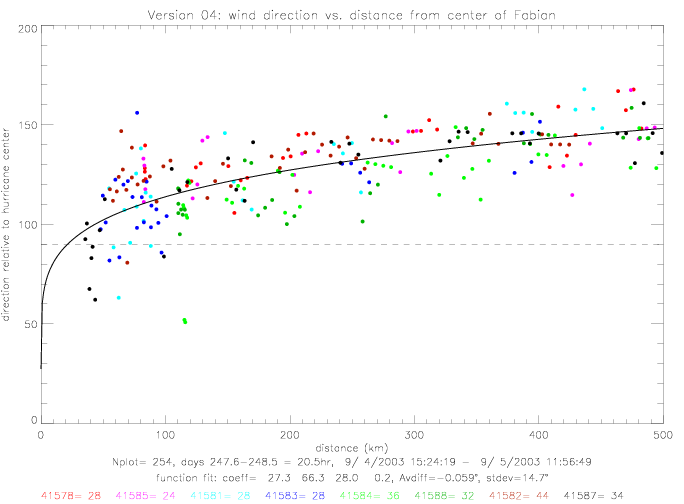
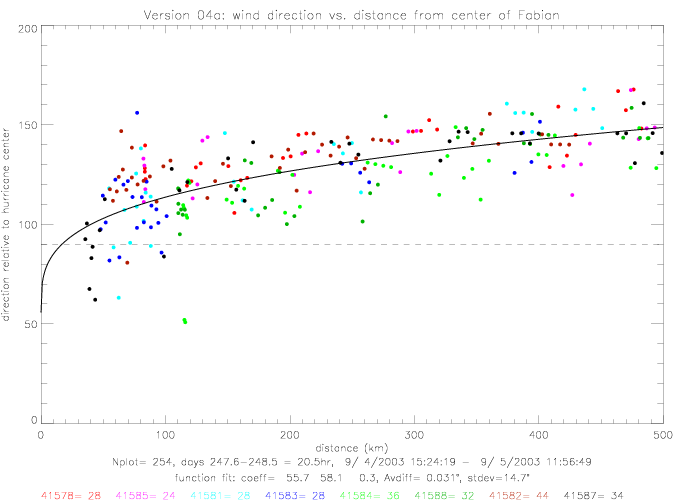
These functions differ mostly at small distances (< 70km), where the curve-fitting
routine does not have any input data. For distances larger than 70km, version 4 & 4a are very similar to
version 1, but versions 3 & 3a differ. All functional fits are shown in the next figure.
** Note: all previous figures omitted very early drifter observations. **
The missing data were recorded right after the deployment ahead of hurricane Fabian, when the drifters
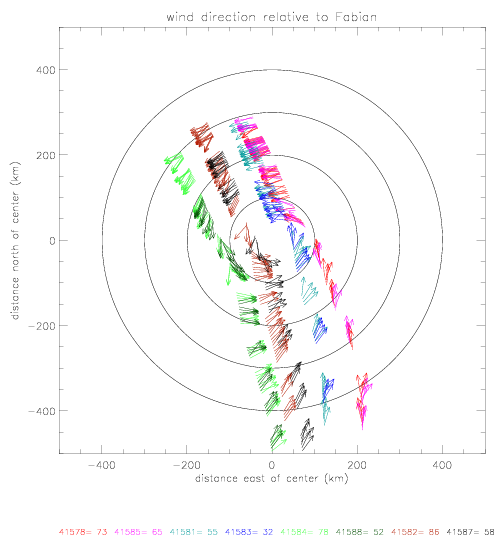
were to the northwest of the hurricane center. These first ca. 15 hours are now inlcuded in the analysis.
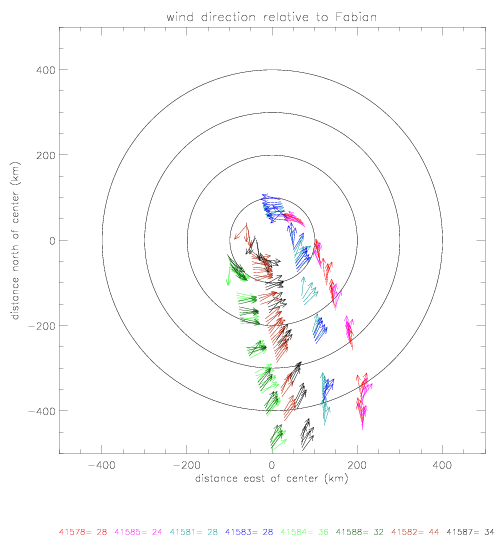
Wind direction plotted at locations relative to the hurricane location are presented
below: left for the sub-sample (omitting the first 15 hours) (a), and right for the entire data set (b).
Functional fits (version 3 and 4) are presented below for the entire data set.
Drifter wind directions north of the hurricane center differ from those to the south of the center
in their functional behavior vs. radius. In the figure below, drifter data north of center
are plotted in black, and south of center in red.
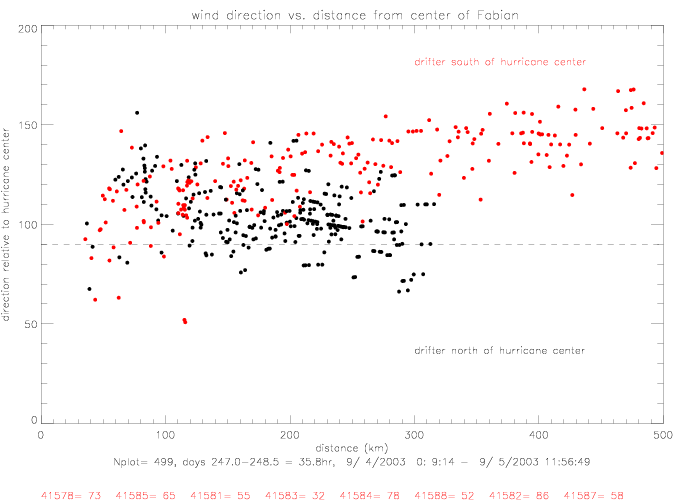
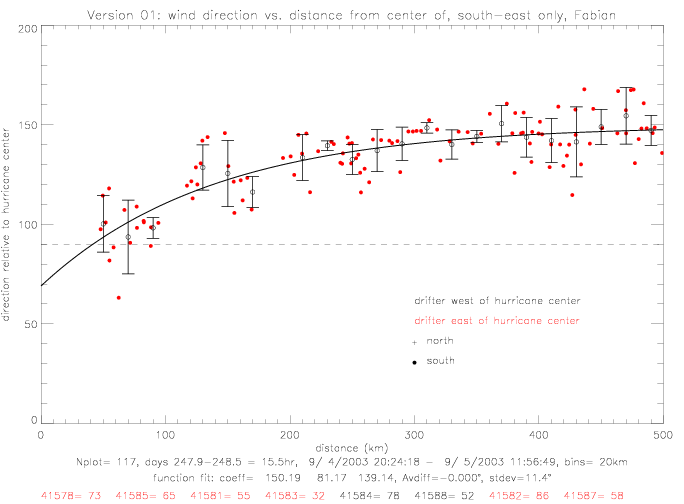
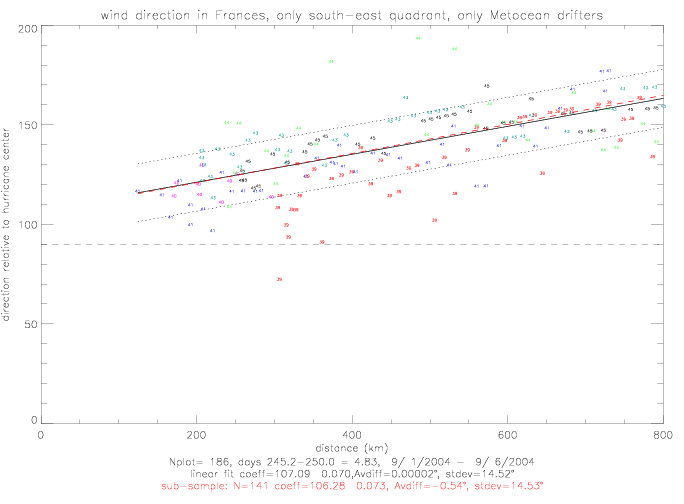
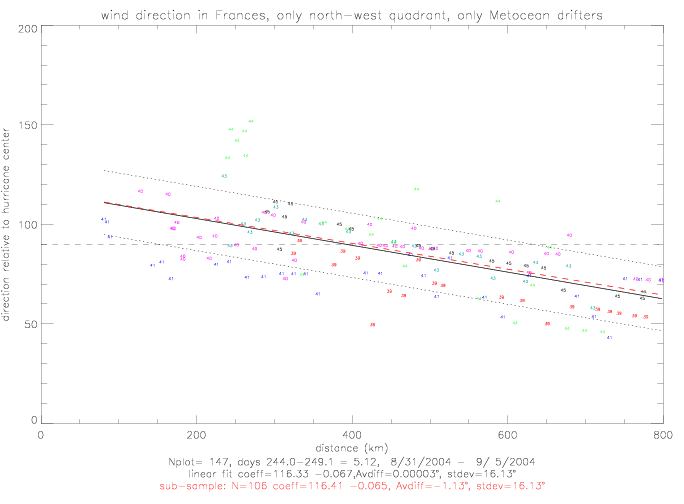
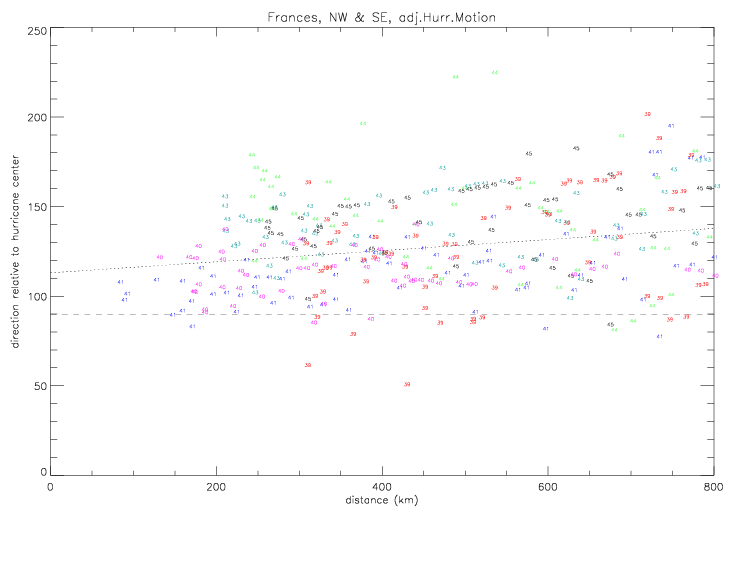
Up to a distance of ca. 100km the direction in the two regions (north and south) behave very similarly, although there are only very few data close to the hurricane center, and none closer than 35km. At distances larger than about 120km, the directions in the southern region tend to be above 120° (pointing slightly towards the hurricane center) and increase, almost linearly, towards a mean of 150° at 500km. In the northern region (northwest of the hurricane), the directions are clustered around 100° (almost radial in respect to the center). In this region the data are limited to distances of less 320km.
Below, the functional fits for directions from the south-east region are shown (version 1 & 4). Also plotted are 20km bin averages.
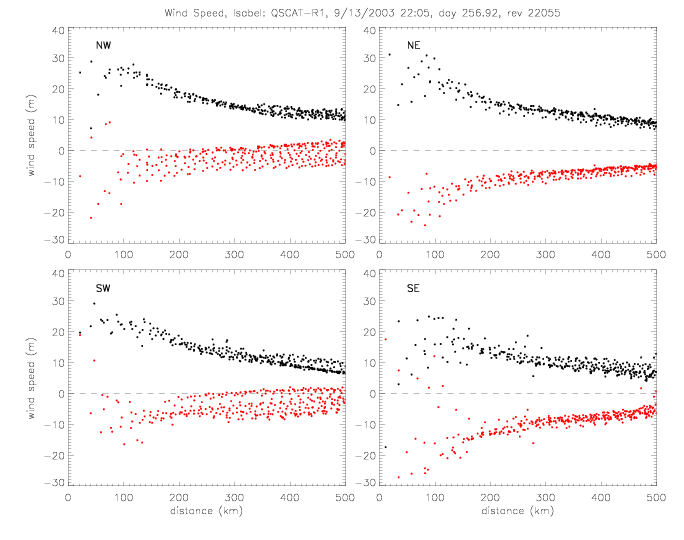
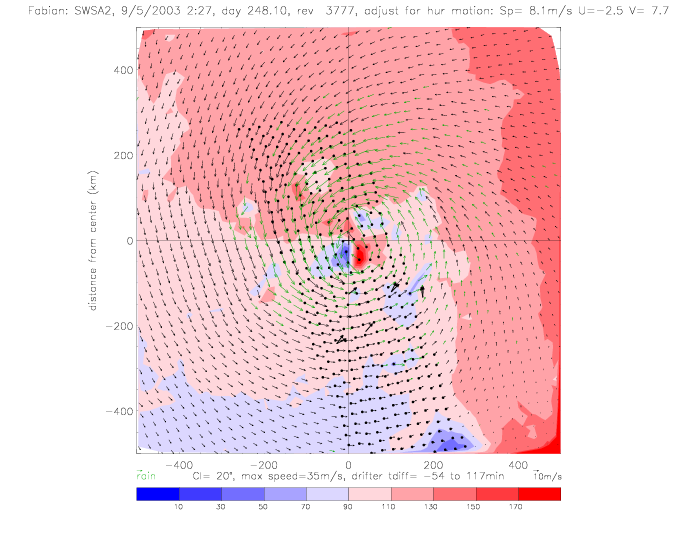
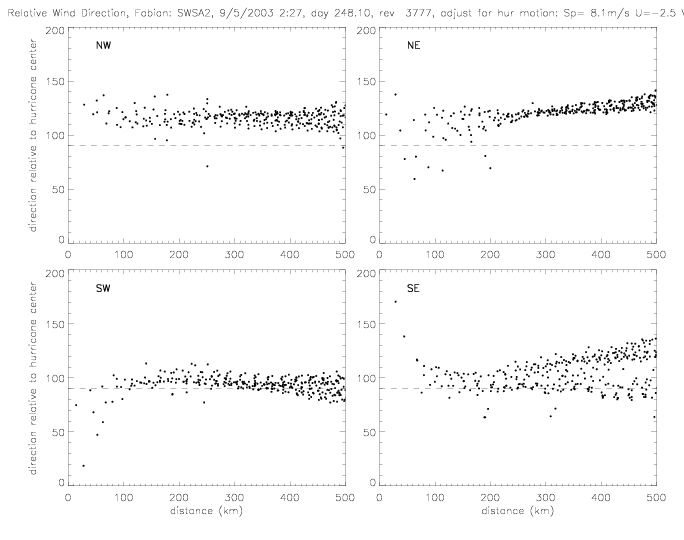
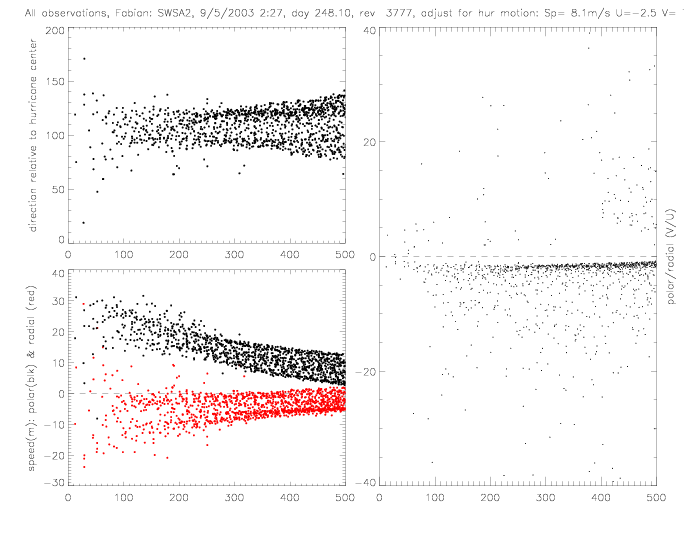
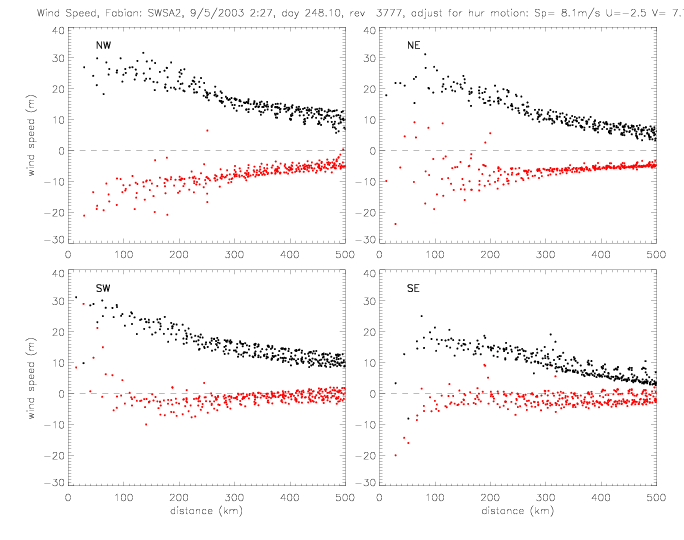
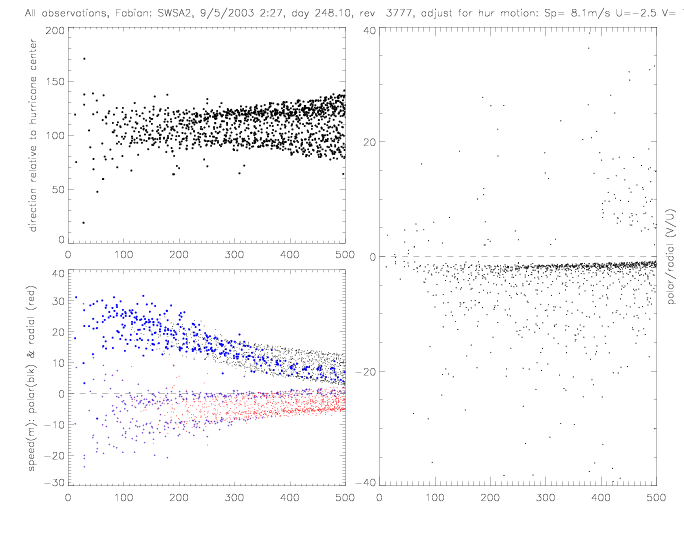
The relative wind direction can also be plotted for satellite swaths: for QSCAT and SeaWinds on ADEOS-II (SWSA2).
In the following figures for Fabian and Isabel, four panels are shown for a 500x500km area around the center of the hurricane:
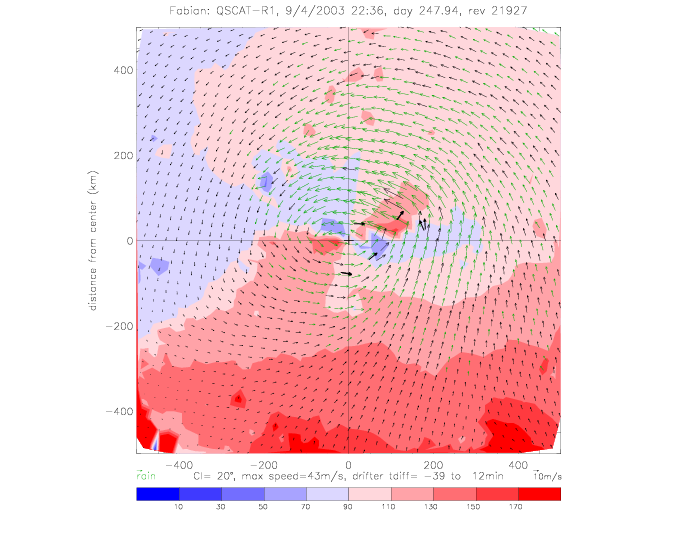
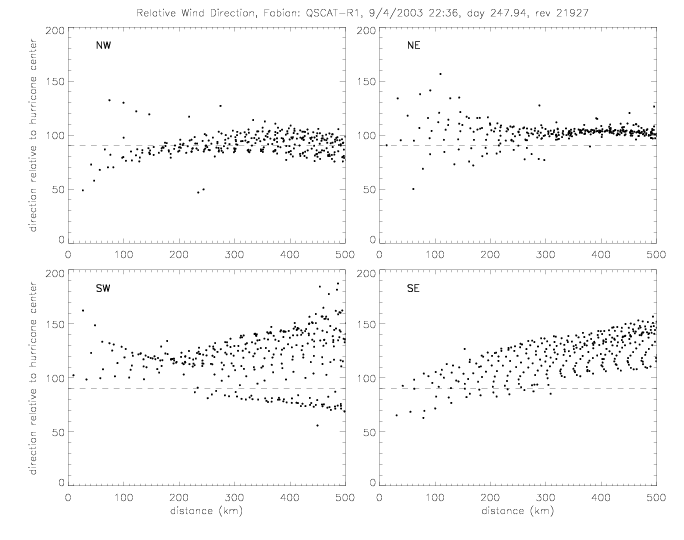
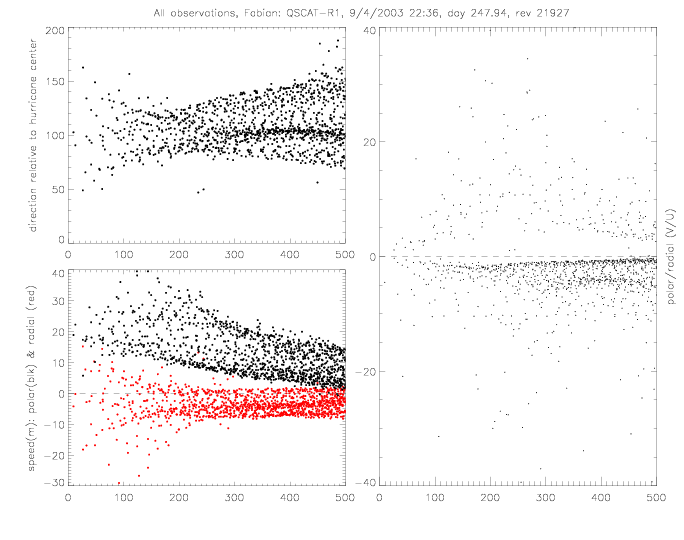
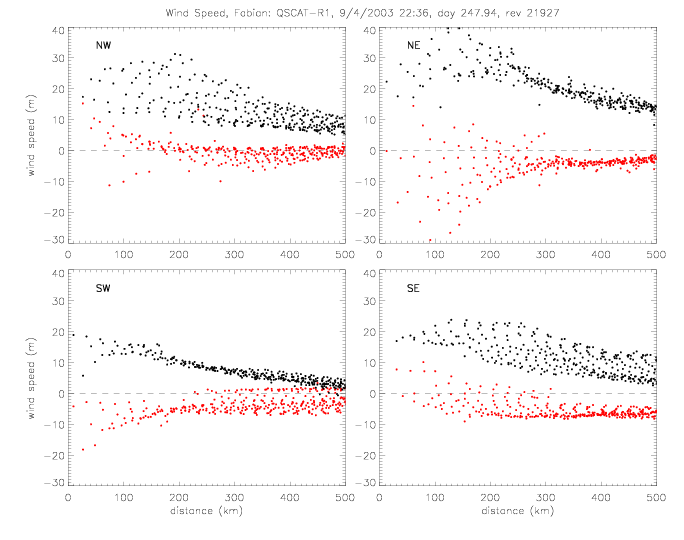
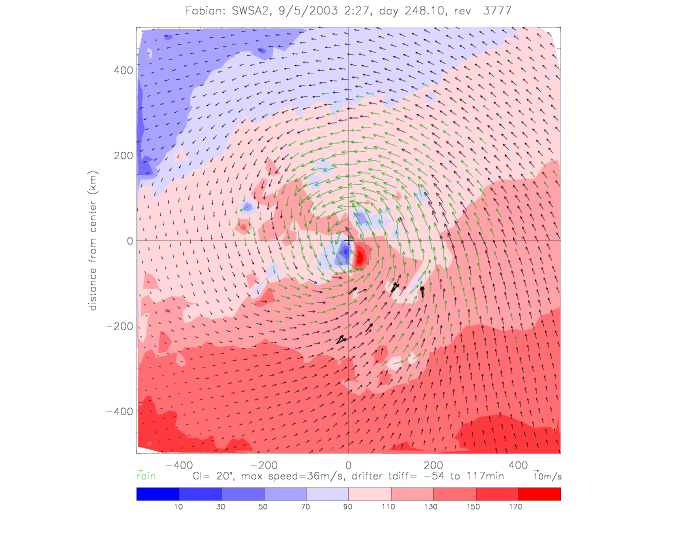
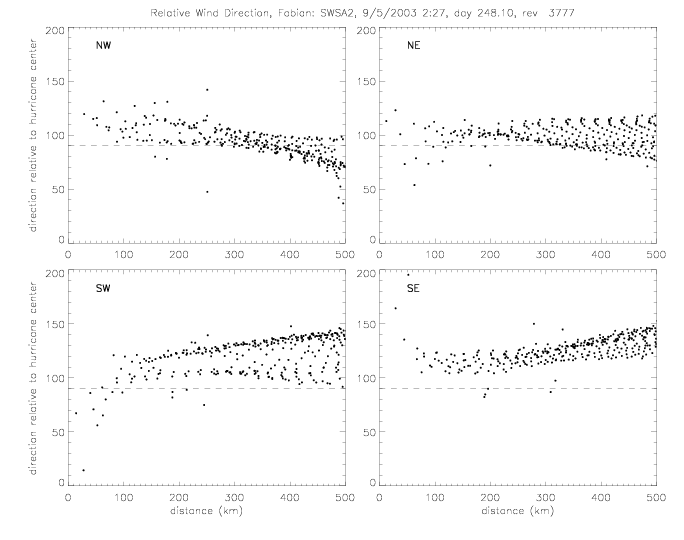
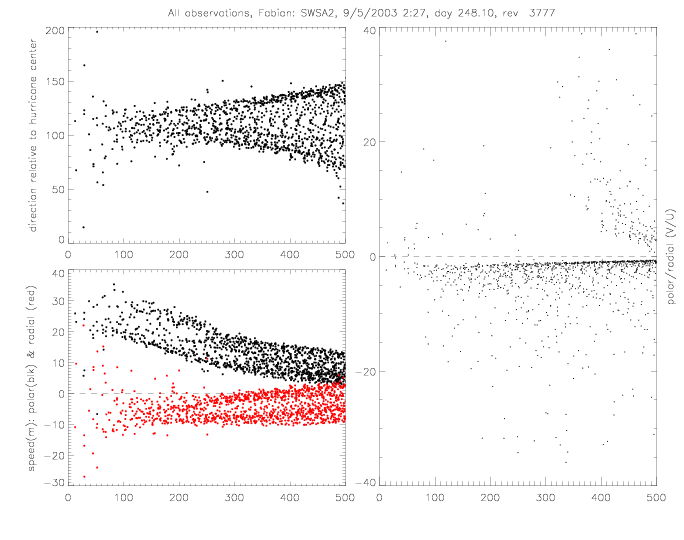
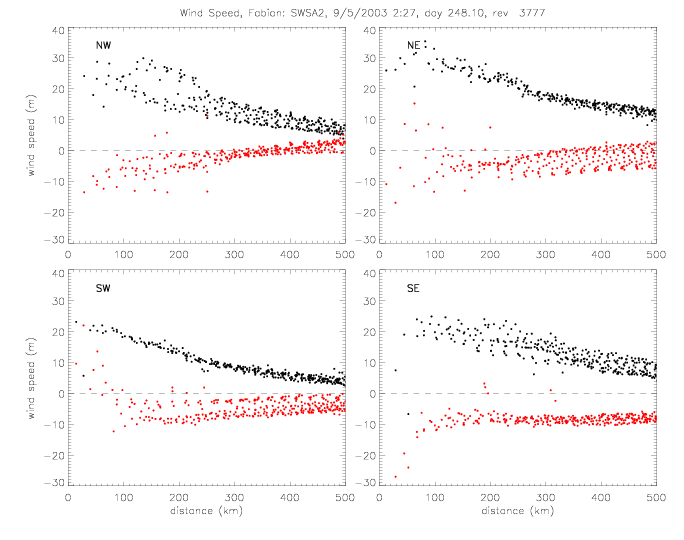
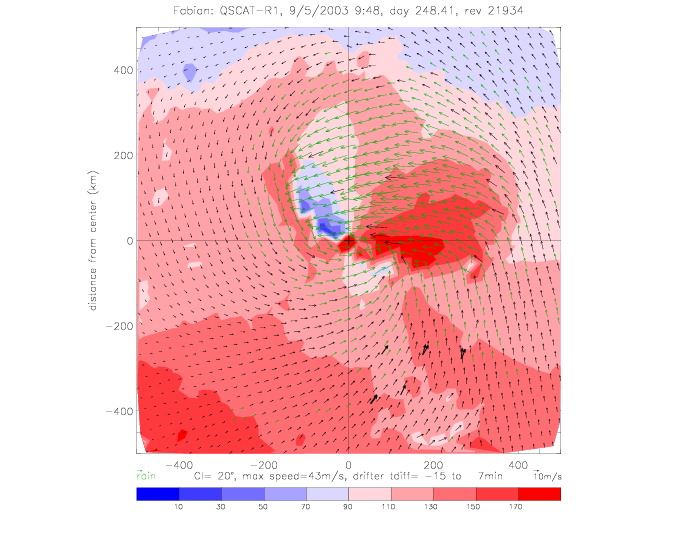
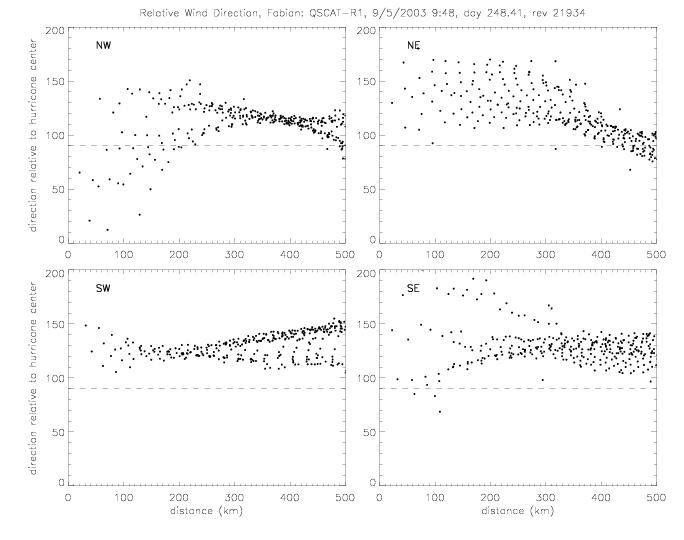
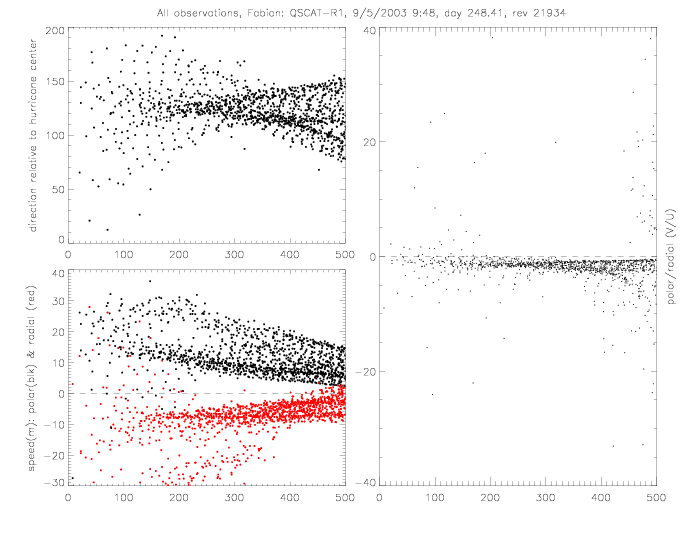
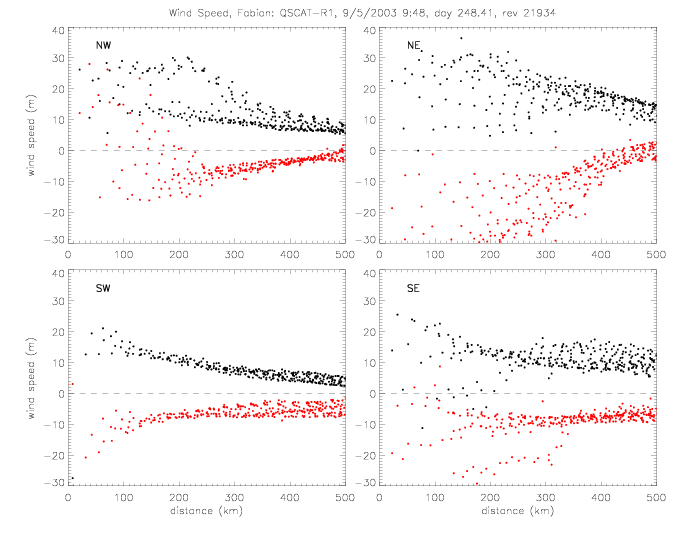
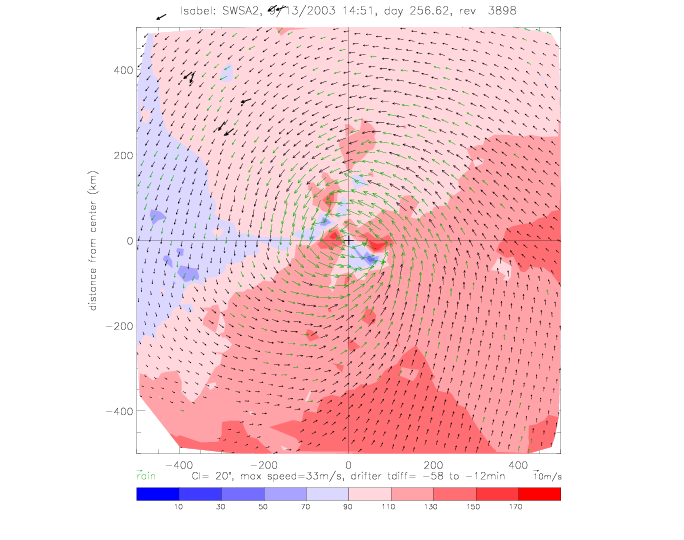
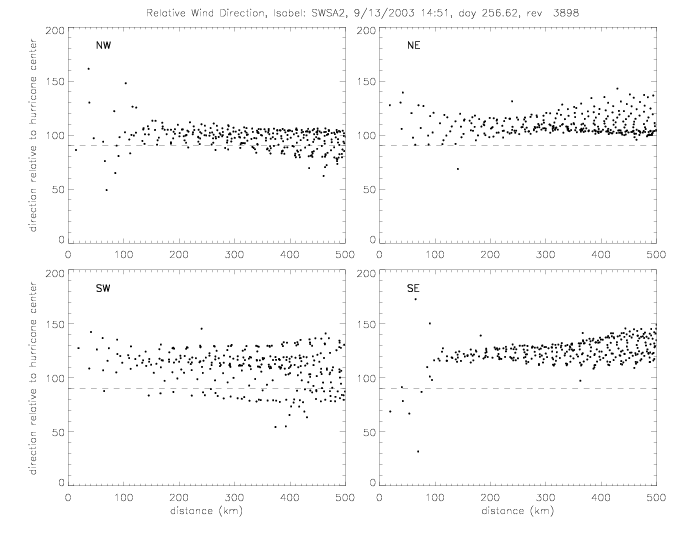
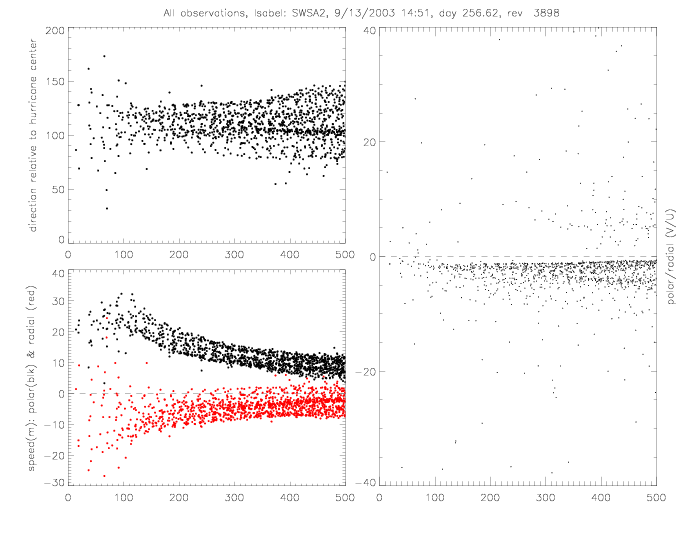
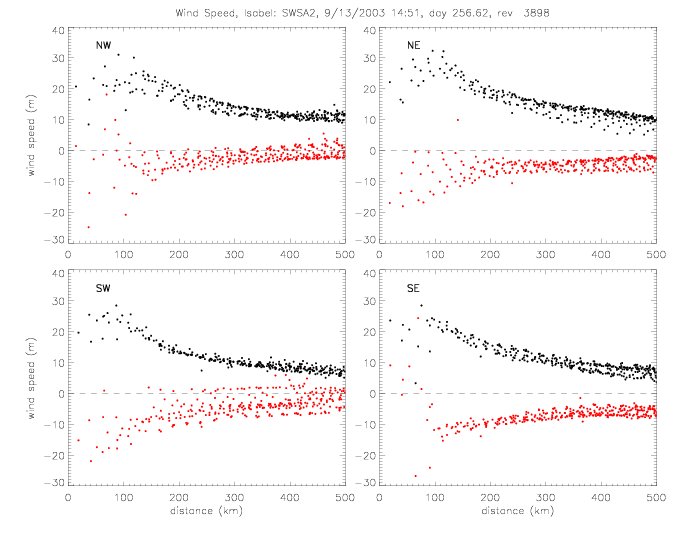
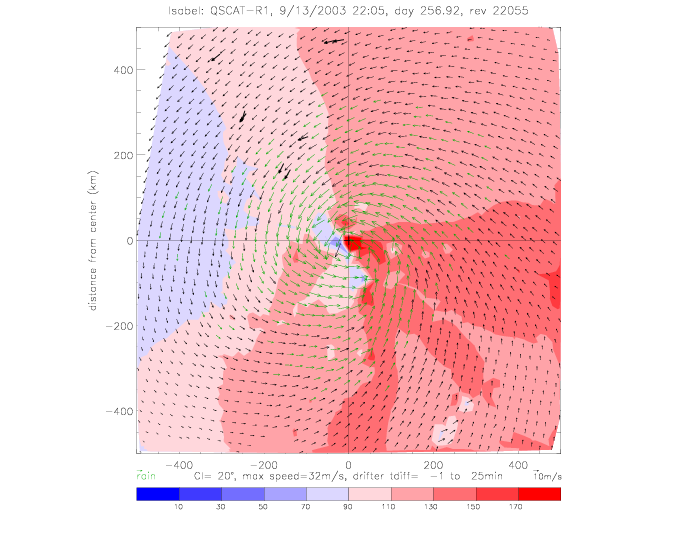
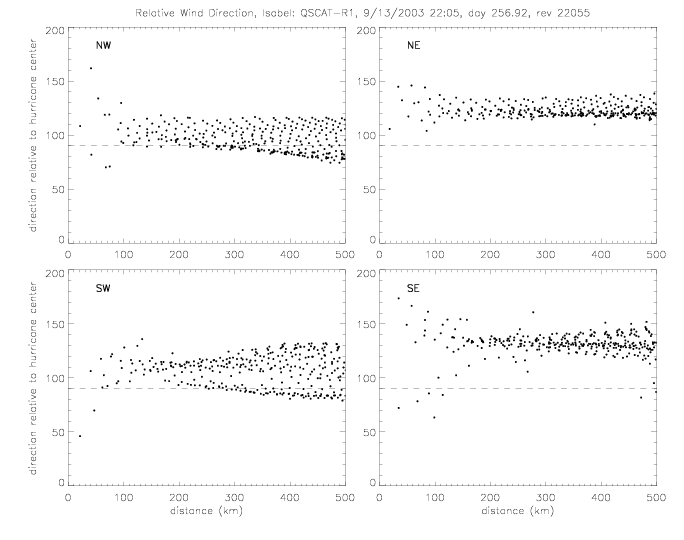
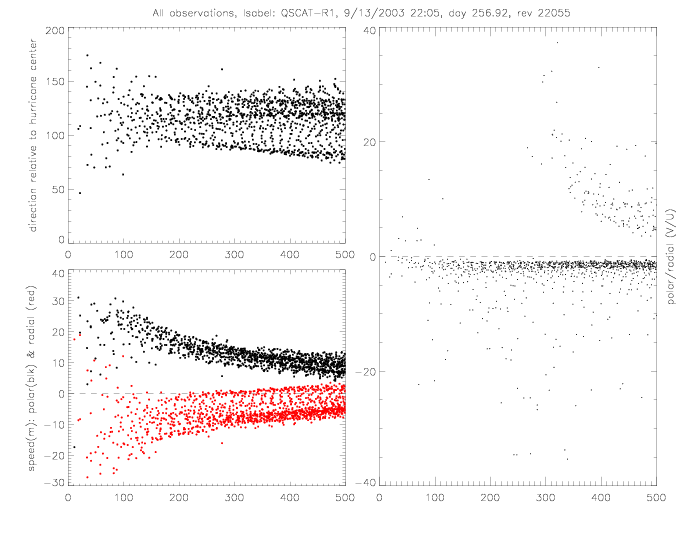
The wind vectors measured at the sea surface (by scatterometer and drifters) are due to the (mostly) circular winds of a stationary system and the motion of the system as the hurricane moves from one area to another. This motion of the hurricane can be subtracted from the observed wind vectors. As an example, this is done for Fabian SWSA2 rev 3777, when the hurricane moved at about 8m/s to the NorthWest (U=-2.5, V=7.7). The following plots show the same quantities as above, but with the "adjusted" wind vectors. The spread of U and V components is slightly reduced.
During the 2004 hurricane season, 9 METOCEAN drifters and 8 ADOS drifters provided wind direction measurements. 14 Minimet drifters measured SST and air pressure, but no wind direction or speed. METOCEAN data derive from the GTS files, and ADOS and Minimet data are from the PACIFICGYRE files. When collocated with QSCAT, average differences or offsets can be computed for all drifters: avDiff = Drifter - QSCAT; see fig. 7.1-7.5 for METOCEAN and fig. 7.6-7.13 for ADOS in wind direction scatter plots. For the following analysis, the drifter data have been adjusted by these offsets. The tables below summarize the wind direction collocation data sets, limited to "no rain" flagged QSCAT data.
| GTS data | PACIFICGYRE | PAC adjusted for avDiff | ||||||
| Drifter | av Diff | rms | N | av Diff | rms | N | av Diff | rms |
|---|---|---|---|---|---|---|---|---|
| 41919 | -4 | 37 | 24 | -6 | 11 | 39 | 0 | 8 |
| 41920 | 8 | 16 | 22 | -13 | 24 | 36 | 0 | 20 |
| 41921 | 34 | 54 | 26 | 21 | 28 | 37 | 0 | 18 |
| 41922 | 17 | 28 | 29 | 0 | 20 | 38 | 0 | 20 |
| 41923 | 5 | 34 | 18 | -13 | 18 | 25 | 0 | 12 |
| 41924 | 18 | 25 | 23 | -1 | 14 | 43 | 0 | 14 |
| 41925 | 12 | 19 | 29 | -9 | 23 | 35 | 0 | 22 |
| 41926 | 3 | 33 | 27 | -4 | 18 | 41 | 0 | 18 |
| average | 31 | 20 | 17 | |||||
| GTS data | GTS adjusted for avDiff | ||||
| Drifter | av Diff | rms | N | av Diff | rms |
|---|---|---|---|---|---|
| 41539 | -4 | 24 | 43 | 0 | 24 |
| 41540 | -2 | 36 | 14 | 0 | 36 |
| 41541 | -13 | 32 | 35 | 0 | 30 |
| 41542 | 36 | 67 | 31 | 0 | 57 |
| 41543 | 23 | 37 | 40 | 0 | 29 |
| 41544 | 27 | 53 | 47 | 0 | 45 |
| 41545 | 15 | 43 | 43 | 0 | 38 |
| 41590 | -8 | 52 | 31 | 0 | 51 |
| 41646 | 6 | 41 | 46 | 0 | 40 |
| average | 43 | 39 | |||
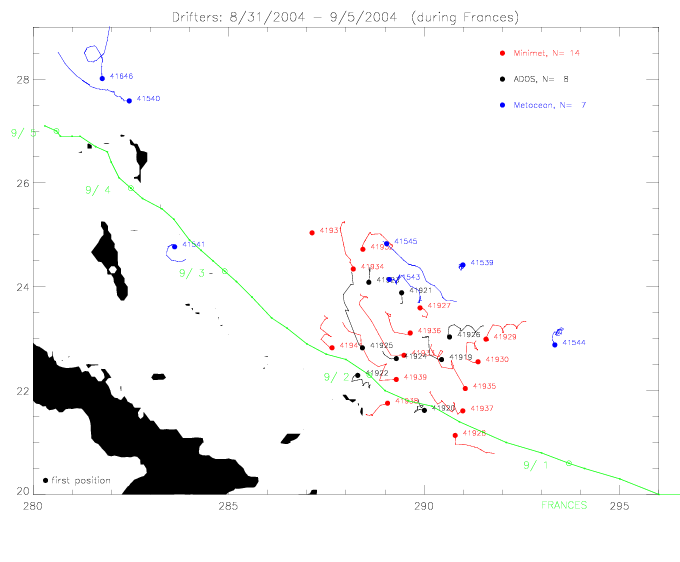
The deployment positions and tracks of drifters during the first 6 days of encountering Frances are shown below.
Eight ADOS drifters have SST, pressure, and wind direction data. ADOS drifter 41921 has also speed, but its measurements
don't start until 9/4/2004 when the hurricane is already 740km away. Seven Metocean drifters have SST, pressure, and wind
direction and speed data; except for drifter 41590 (no direction or speed) and 41646 (no speed). 41542 only gets within 610km
of the hurricane center. There also fourteen Minimet drifters with SST and pressure data.
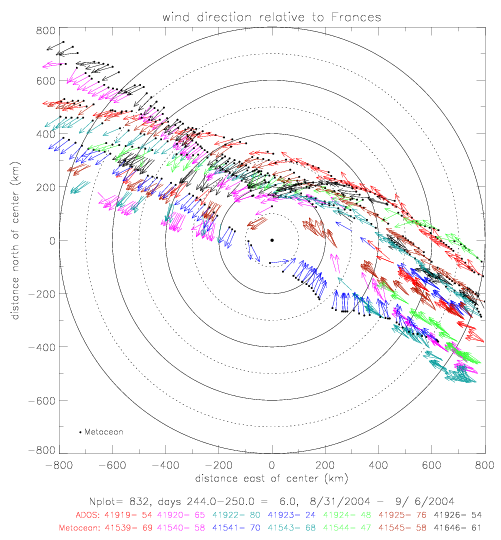
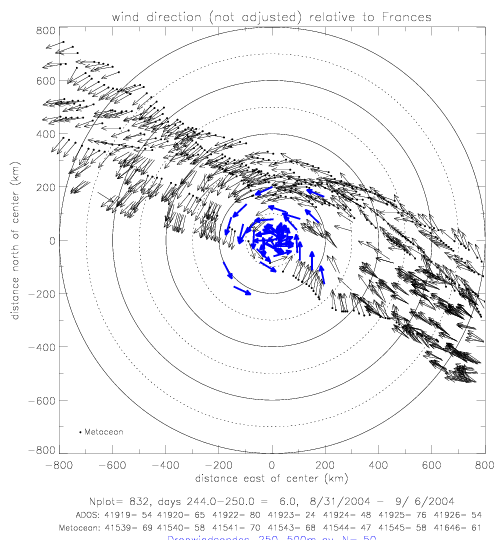
Available wind direction data within 800km of the hurricane center are plotted below on a map, relative to the center of Frances.
Shown are 7 ADOS and 7 Metocean drifters. The plotted vectors are of uniform lengths, and do not reflect the measured speeds.
Metocean data are marked with a dot at the base of the arrows.
As the hurricane is approaching the drifters, its northwest quadrant is measured.
Here the wind directions are close to radial (i.e. circular around the center) within 400km. Further away, the winds tend to
blow increasingly away from the center. In the southeast quadrant , measured as the hurricane was moving away from the drifters,
the drifter-measured winds tend to blow towards the center. In particular at very large distances
(800km), the winds are directed almost straight towards the center.
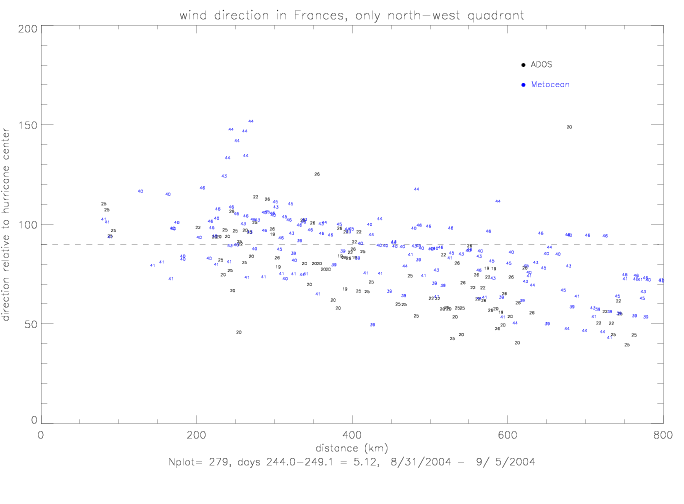
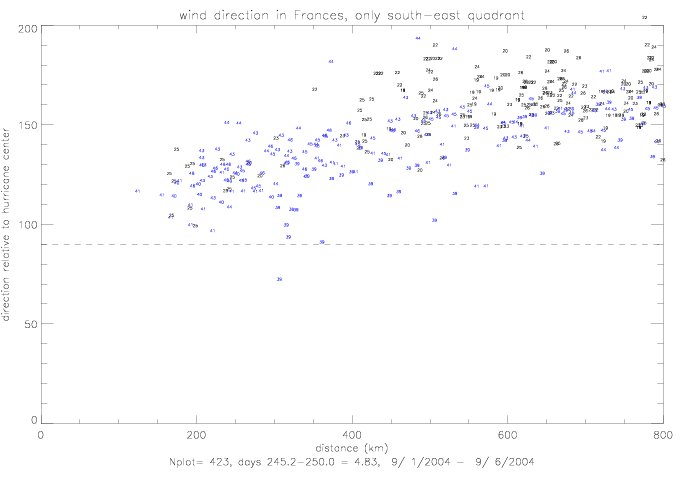
In the following figures, the relative wind directions are shown. As explained above, a relative angle of 0° corresponds to a wind
blowing directly away from the huricane center with increasing angle in the counterclockwise direction. An angle of 90° comes from a circular wind,
blowing counterclockwise around the hurricane center, and 180° is a wind blowing directly towards the center.
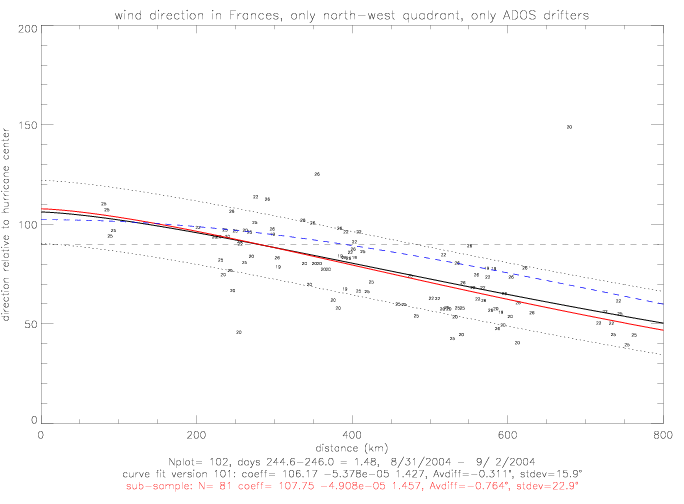
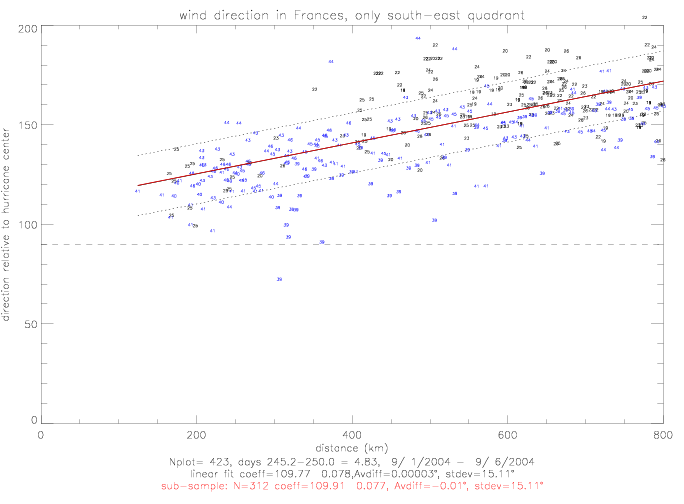
Data from the north-west and south-east quadrants are plotted separately. ADOS drifters are plotted in black, Metocean in blue. The numbers
on the plots are the last two digits of the drifter IDs.
It appears that at larger distances (>400km) the ADOS relative wind directions tend to move away from 90° (i.e. less circular flow) more
rapidly than the Metocean measurements.
Functional fits for relative wind direction vs. distance are presented below: for a linear fit (dir = a + b · dist), and also for
an exponential fit (dir = a · e (b · dist c). Coefficients are determined by least-square
differences, and listed in the subtitles. In all the examples, an initial estimate of the
fit are calculated (plotted in black). Then the standard deviation of the differences between this estimate and the data is calculated.
The initial fit +/- 1 stdev are marked with dashed lines. Finally, a sub-sample of the data is used for a final fit (plotted in red),
by using only data that fall within +/- 1 stdev of the initial fit. In all cases, the two functional fits do not differ very much
from each other, indicating very stable estimates of the coefficients.
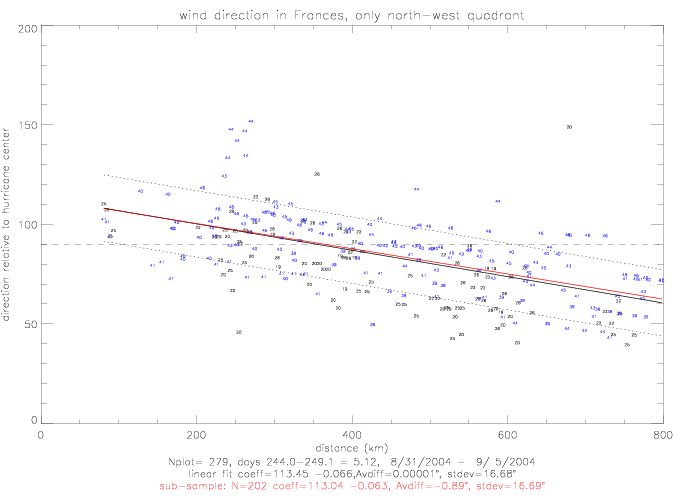
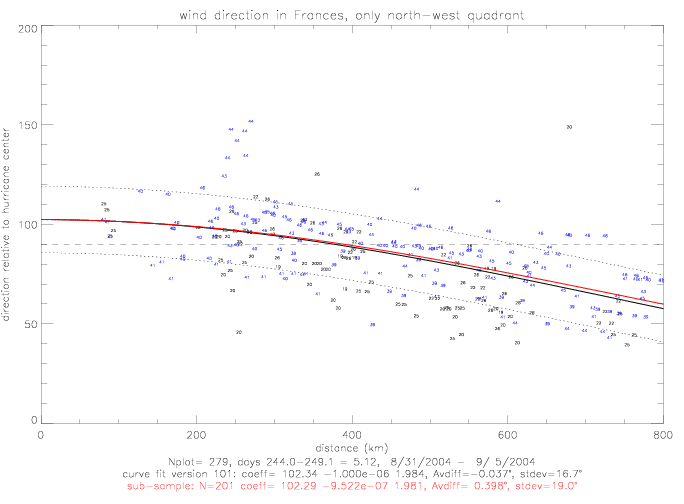
The linear and exponential functional fits do not differ by more than 3° from each other, except at distances less than 150km where there
are not very many data (only 9 measurements). The linear fit is 113° at 0km, and the exponential is 102° .
The coefficients for the linear fit are 113.0 and -0.063, and for the exponential fit 102.3, 9.5 · 10-7, and 1.98.
The ADOS data tend to have smaller direction values than the Metocean observations. The functional fit for only ADOS data is
shown below. The fit of all data is indicated by the blue dashed line. At distances > 500km the ADOS fit is about 15° lower than
the fit to ADOS and Metocean.
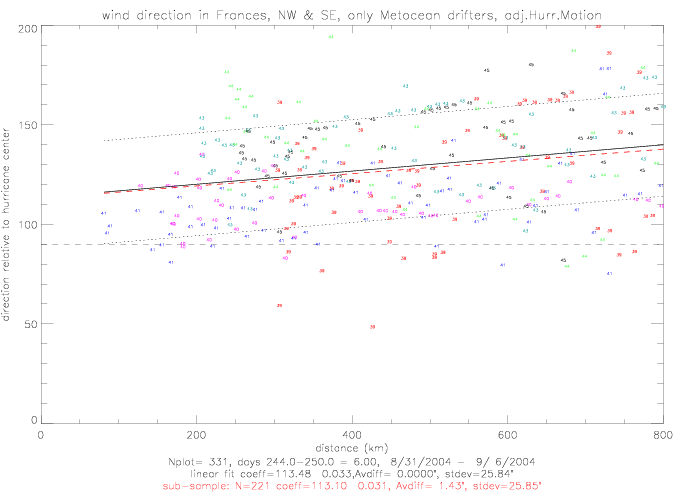
The linear fit for relative wind directions in the south-east quadrant of the hurricane is presented below. These wind directions
were measured as the hurricane was moving away from the drifters.
Adjusting for hurricane motion
The hurricane is not a stationary system, but moves at considerable speed across the ocean. This motion of the hurricane can be computed. In the time period of 8/31 - 9/6/2004 hurricane Frances moved at speeds of 2-10m/s. The adjusted drifter observed wind speeds and directions due to the hurricane motion are examined below. In the following figures, observed drifter wind speed and directions are corrected with the speed and direction offsets computed from the collocation with QSCAT observations (see tables 4.2.1 and 4.2.2 on this web page, and table 8.1 on Hurricanes Frances and Jeanne .
To adjust for the hurricane motion, both wind direction and speed data are required from drifters. Therefore, only Metocean drifters are plotted below. ADOS drifter 41921 has good speed, but its closest distance to hurricane Frances is only 738km. Metocean drifter 41646 does not have any good speed observations, and drifter 41542 only got within 606km of the hurricane center. That leaves only 6 Metocean drifters for this analysis: 41539, 41540, 41541, 41543, 41544, and 41545.
The observed wind direction and speeds are plotted relative to hurricane center below. In this figure, the length of the
vector reflects the observed speed (scale vector is indicated in the bottom right corner).
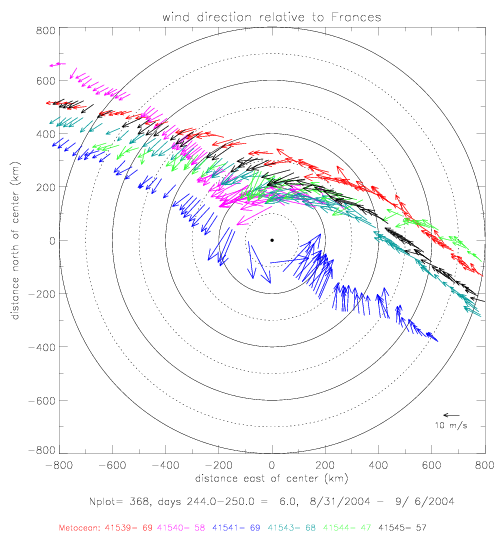
The adjustment is illustrated below. Colored lines reflect the non-adjusted drifter vectors; black arrows show the hurricane motion
linearly interpolated to the drifter observation; and arrows with solid tips are the adjusted drifter wind vectors. For better
illustration only every other vector is plotted.
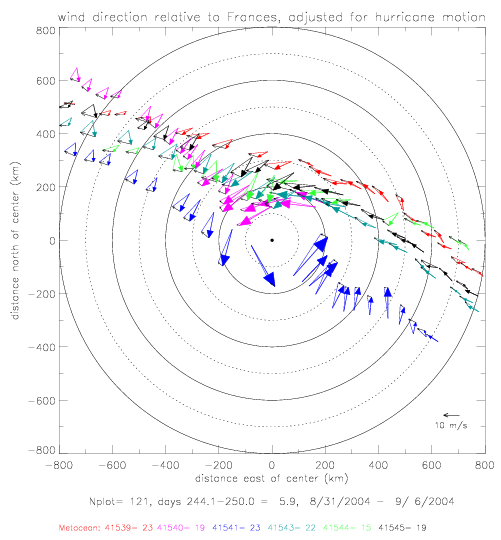
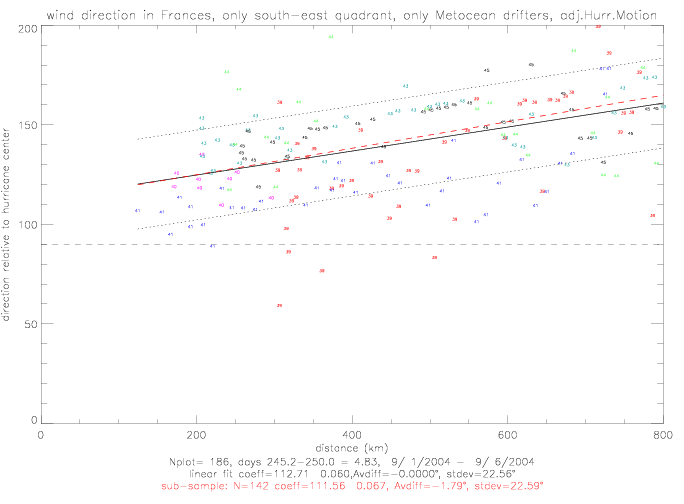
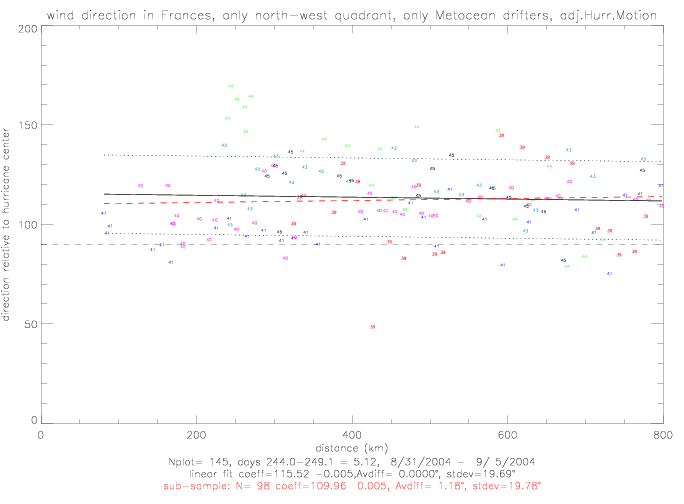
The figure above shows that wind directions to the east of the hurricane center (as the hurricane was moving away from the drifters), referred to below as the "south-east quadrant", are not effected very much by the adjustment. In the north-west quadrant, however, the adjustment tends to turn the wind directions more towards the hurricane center.
In the next figures, the relative wind directions from Metocean drifters are plotted. Observations are shown for the south-east and
north-west quadrants separately. On the left, the non-adjusted directions are plotted; on the right, the adjuested
data are shown.
In the next figure, the data from both quadrants are combined, and the linear fit to the observations is calculated.
The coefficients are c0 = 113.1 and c1 = 0.031 for dir = c0 + c1*dist(km).
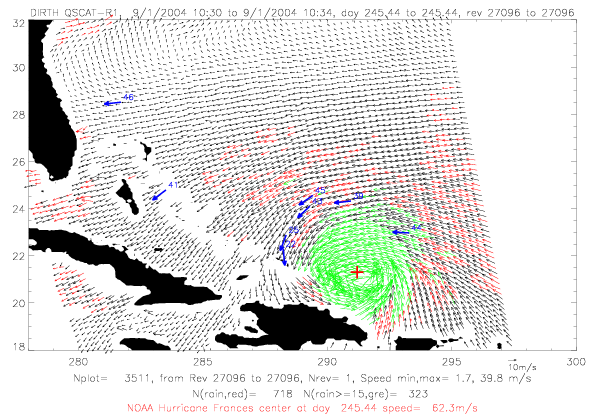
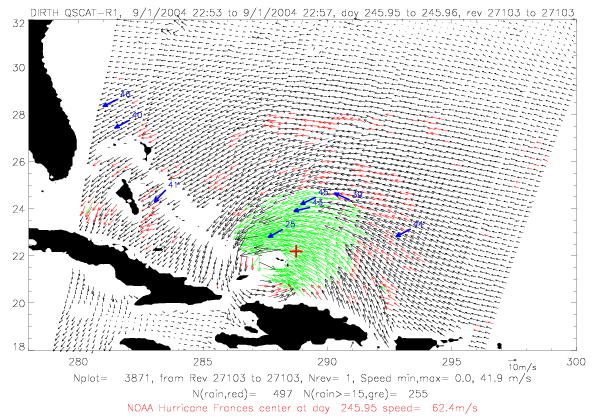
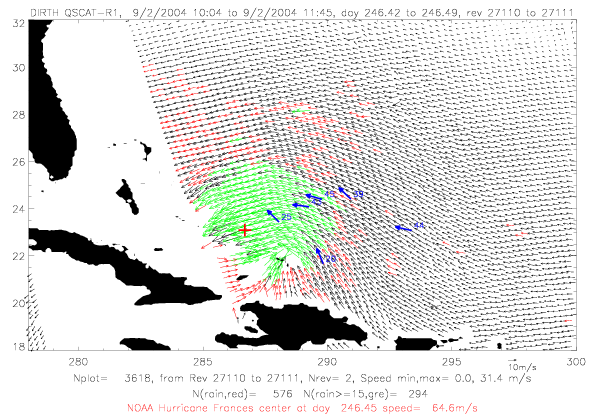
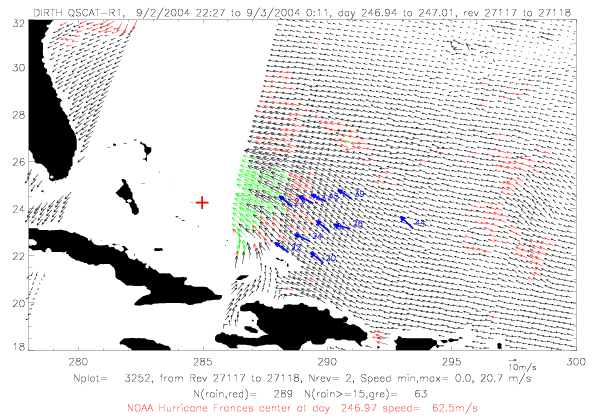
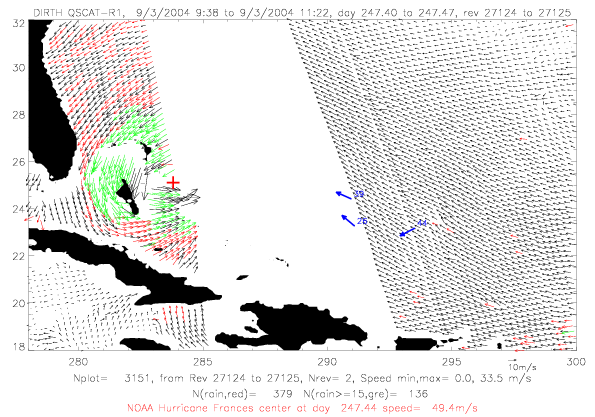
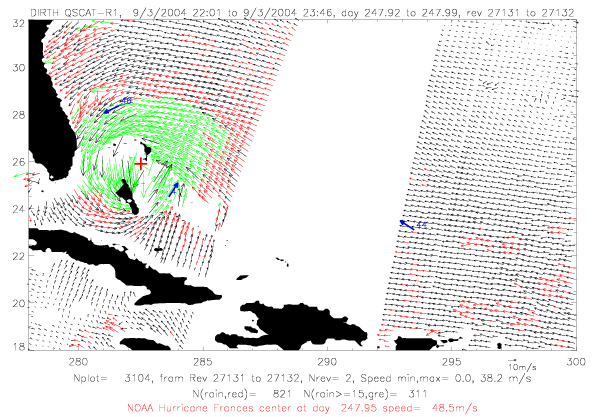
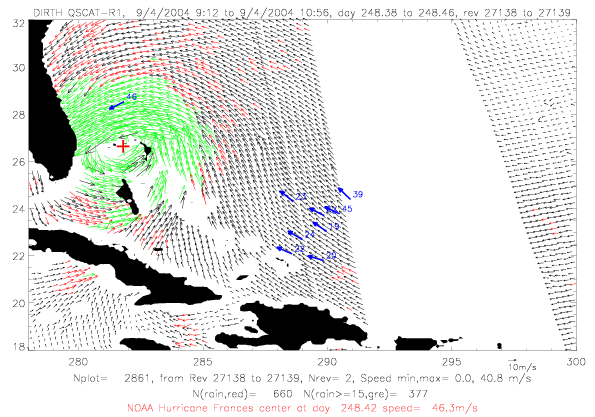
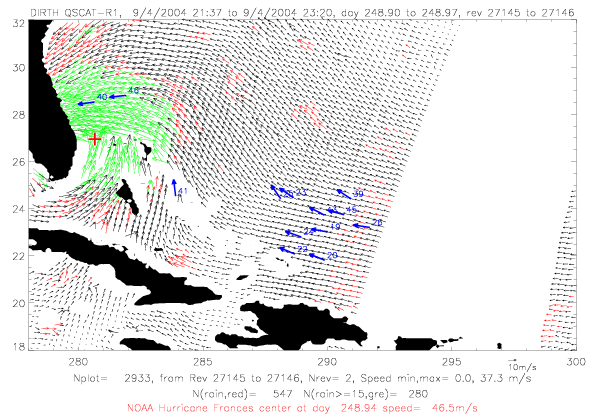
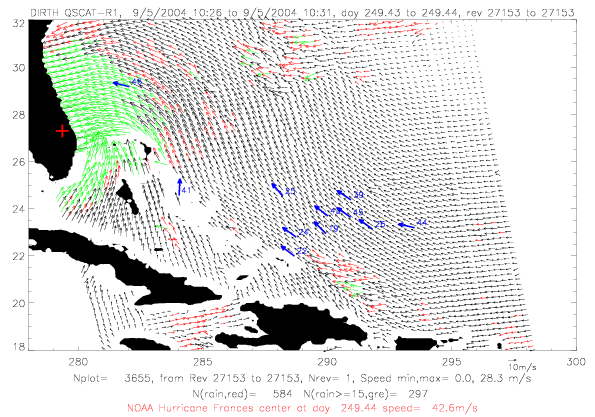
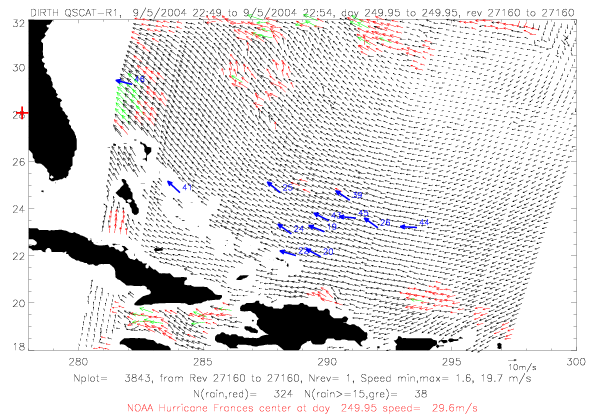
In the next section QSCAT surface wind data for Frances are shown for five days during 9/1 - 9/5/2004. In all figures
rain-flagged vectors are plotted in red, rain-flagged vectors with speeds &ge 15m/s are in green. Drifter observations
within a few minutes of the scatterometer data are shown in blue. Drifter vectors do not represent observed speeds:
ADOS and Metocean drifters are plotted, and only Metocean drifters have speed observations. The last two digits
of the drifter ID are written on the figures. Finally, the NOAA best track hurricane center, interpolated to the
rev time, are plotted in red.
S is wind speed (m/s), &theta is relative wind direction, 0° means blowing directly away from hurricane center, 90° is oriented counterclockwise around the hurricane center, U is radial velocity (m/s): positive U means pointing away from the center of the hurricane, negative U (&theta>90°) means pointing towards the center, V is polar velocity (m/s), or "circular" component (in hurricane V >> U), positive V denotes a counter-clockwise flow, r is radial coordinate (m), f is coriolis parameter (0.000064 1/s), and &rho is density of air (1.29 kg/m3).
With pressure and relative wind directions defined according to functional fits derived in above chapters, the momentum equation can then be solved by numerical integration using the Runge-Kutta technique (a fourth-order method). It requires an equation for the gradient of speed, which can be derived as follows:
Given a boundary condition, this equation can be integrated iteratively for speed.
Also, a simplification of the radial momentum equation (E.1) is examined. Neglecting the term UdU/dr leads to the "Gradient Wind Approximation":
One solution to this equation is
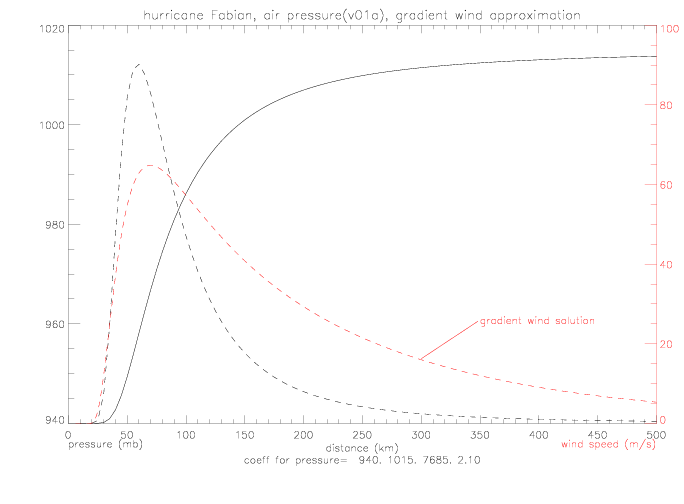
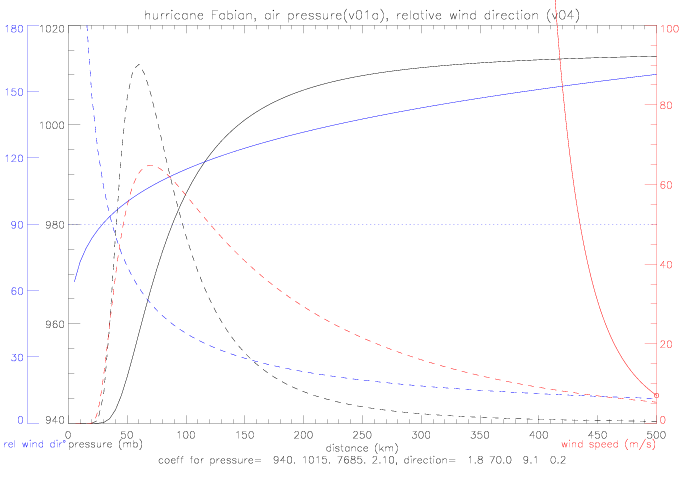
Coefficients for direction are (1.8, 70.0, 9.1, and 0.2), and pressure (940., 1015., 7685., and 2.1).
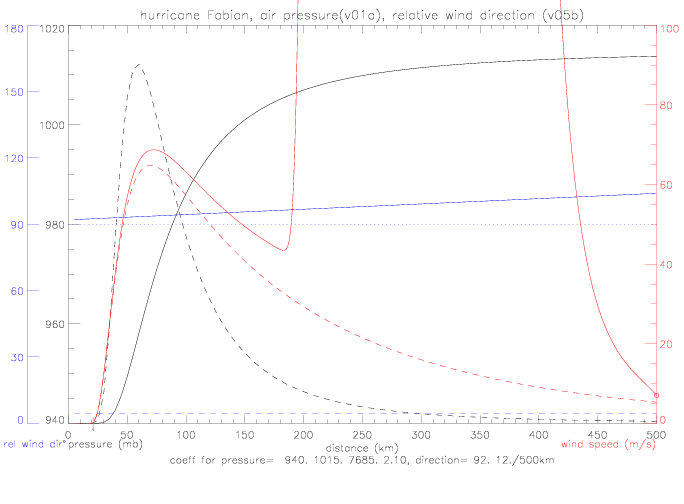
The solution to the Gradient Wind Equation is shown below (dashed, in red). The pressure function is also shown (version v01a, in black), as well as the derivative of the pressure function (dashed, in black; units are in mb/km, scaled to units of 0 to 1 on the y-axis).
When trying to solve the radial momentum equation with the relative wind direction as specified in version v04, the iteration "blows" up very quickly. A boundary condition for speed of 7m/s at 500km was used. In the figure below, the wind direction function is plotted in blue (with its derivative, dashed). For comparison, the Gradient Wind solution is plotted in red (dashed).
The solution is very sensitive to the specification of wind direction as a function of r. To illustrate this sensitivity, wind direction is defined to be very close to 90° : a linear function of radius r, starting with 92° at r=0km, and increasing by 10° to 102° at r=500km. In this case, a solution to the radial momentum equation is possible, and the resulting speed function is plotted below (from boundary condition of 7m/s at 500km).
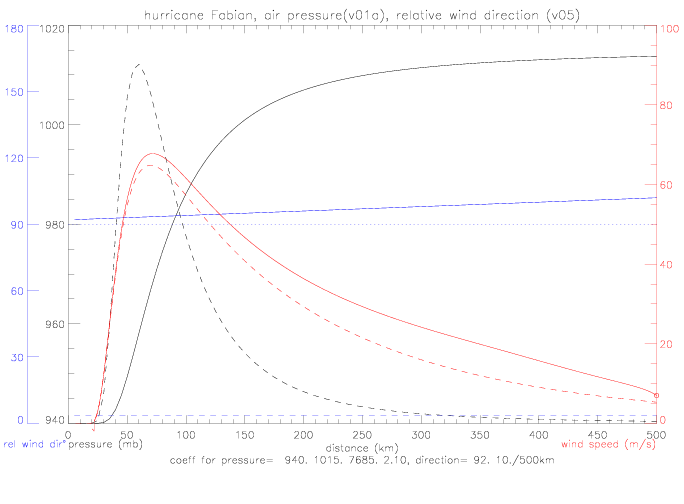
In this approximation (v05 for direction), the radial velocity component (U) is very small and the relative wind direction (&theta) is close to 90° . The iteration of the radial momentum equation results in a solution very near the Gradient Wind approximation. That solution was the special case of U=0 or &theta=90° .
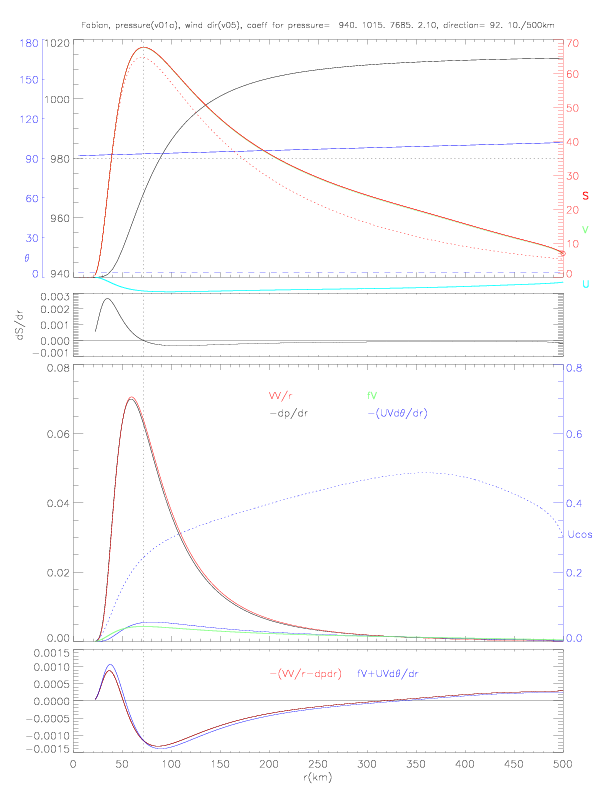
The relative importance of all the terms in the radial momentum equation and their respective influence in determining the speed gradient (E.2) is illustrated below (fig. 5.1.4), for which the relative wind direction is specified by version v05, as in fig. 5.1.3 above.
The upper panel shows the required input for the numerical iteration: pressure vs. distance (in black), and wind direction (in blue). The derivative of wind direction is also plotted (dashed, blue line - scaled to units of 0 to 1 on the y-axis). The solution from the iteration is wind speed (in red, units on right y-axis in red). Also plotted are V (in green, being just slightly less than speed), and U (in light blue), which is negative. U reaches a maximum of ca. -4m/s at a distance of r=90 to 100km. It is plotted with the same scale as speed and V. Maximum speed is reached at r=72km. For comparisons, this distance is indicated in all panels by a black dotted line.
The second panel shows the gradient of speed ( dS/dr ). It is the most positive at about 35km, crosses zero at r=72km, reaches the most negative value at about 100km, and remains negative for all larger r.
The third panel shows all terms required to compute the gradient of speed (E.2). All terms are plotted with units as shown by the y-axis on the left, except the Ucos term, whose units are shown by the y-axis on the right. The VV/r term is plotted in red, -dp/dr in black, fV in green, -(UVd&theta/dr) in blue, and Ucos in dashed blue. VV/r is balanced by (-dp/dr), and fV is balanced by -(UVd&theta/dr).
In the last panel, the differences of the two pairs of balancing terms are plotted: -(VV/r-dp/dr) in red and fV+UVd&theta/dr in blue. When the blue line falls above the red one (r=0-72km), the gradient is positive; and for blue less than red (r>72km) the gradient is negative. The speed gradient derives from the "difference of two differences" that are very similar in magnitude, and is therefore, very sensitive to all terms in the E.2. The value for dS/dr is computed by using the difference and dividing by Ucos. For example, at maximum positive gradient, the difference is about +0.0002 (see last panel), and Ucos is ca. 0.075 (third panel): dS/dr &asymp 0.002/0.07 &asymp 0.0027 (m/s/m), which agress with the maximum value for dS/dr plotted in the second panel.
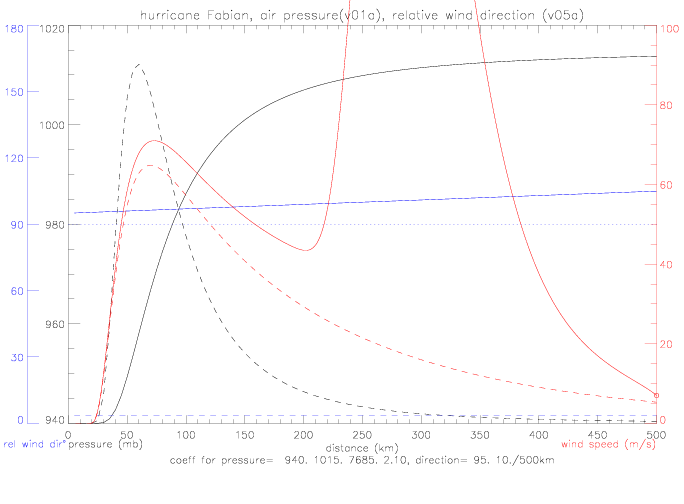
Only slight variations of &theta in version v05 lead to unrealistic solutions. Two variations are considered: first, &theta is specified with a slightly larger intercept at r=0km (95°, instead of 90°); and, secondly, with a slightly larger gradient (12°/500km, instead of 10°/500km):
The solutions to those two variations are shown below.
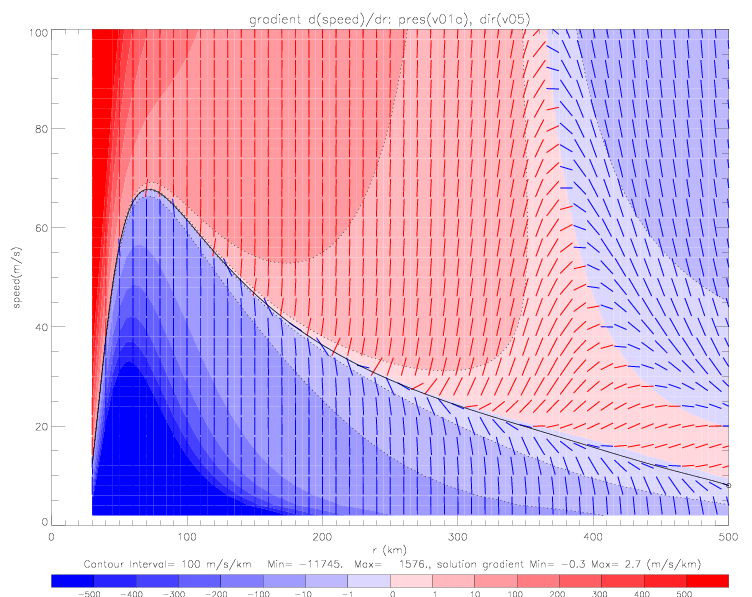
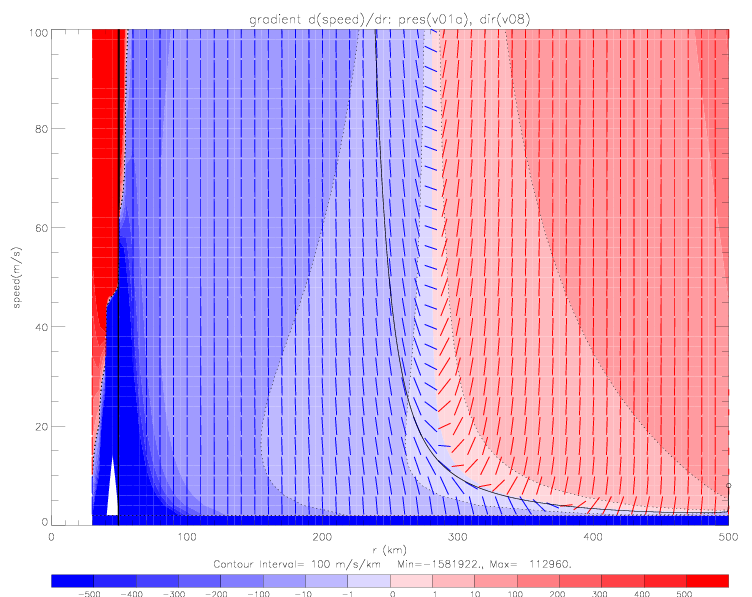
To illustrate how these solutions come about, the speed gradient is contoured as a function of r and speed (see next figure). Note that the contour interval is 100 (m/s/km), but that the contour intervals for -10, -1, 1, and 10 are also shown (with dotted contour lines). To indicate the magnitude of the gradients, short gradient segments are drawn on top of the contours: positive gradients in red, and negative in blue. Also plotted is the speed solution based on linear wind direction (v05: from 92° at 0km to 102° at 500km, black line), derived from a boundary condition of 8m/s at r=500km. In the previous figure it can be seen that the gradient along the solution is always negative for r>72km, which means for this figure that the solution falls into the light blue contour region with a gradient of 0 to -1 (m/s/km) or -0.001 (m/s/m).
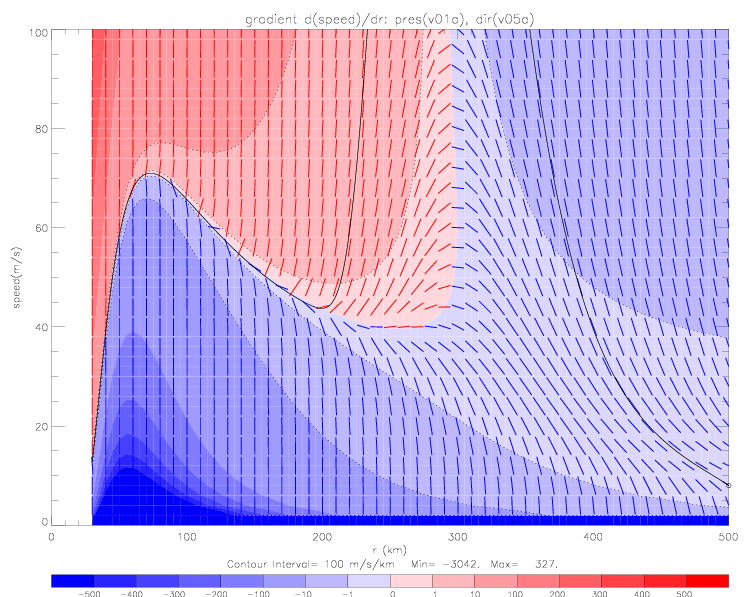
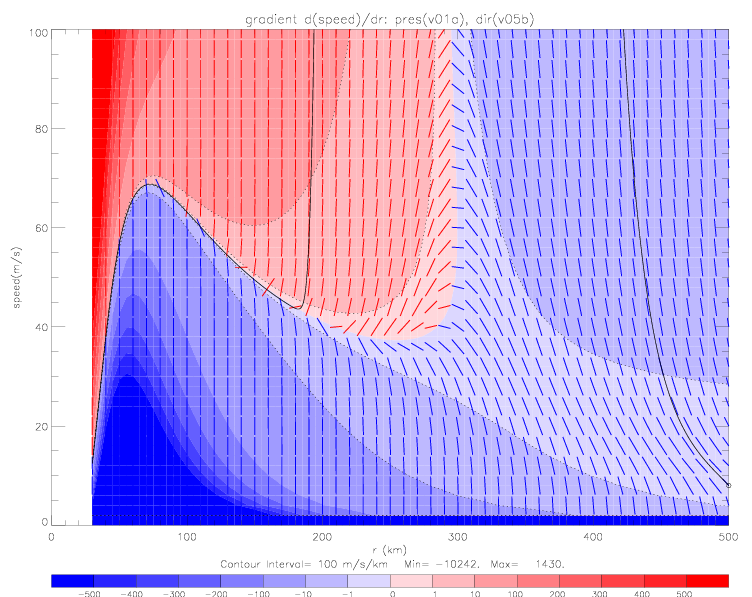
Similar plots can be made for v05a and v05b specified wind directions, and using the same boundary condition (8m/s at 500km). In these cases, the numerical solutions reach unrealistically high speed values not too far away from the boundary condition, but converge towards solutions not very different from each other and the v05 solution at r <200km..
In the following figure, v05 wind directions are used, with seven different boundary conditions: 1m/s, 8m/s, 15m/s, 20m/s, and 35m/s at 500km, 60m/s at 300km, and 20m/s at 200km.
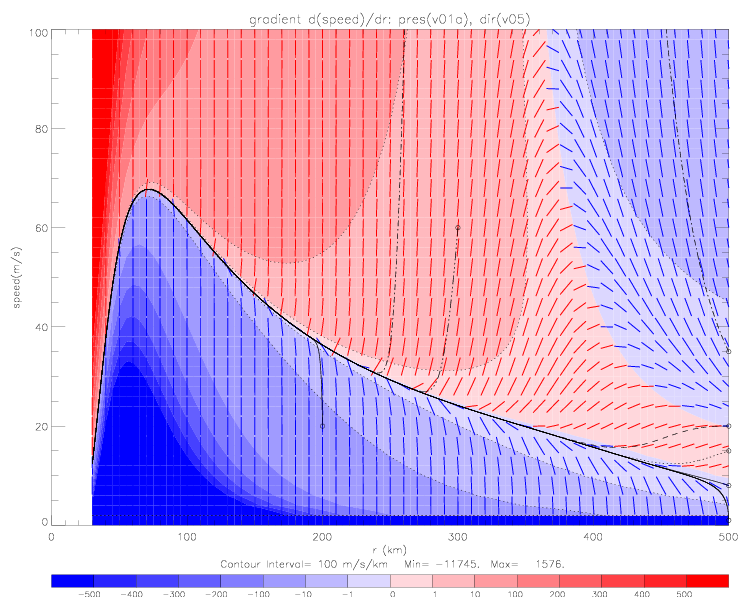
These plots show that numerical solutions converge very quickly to a "preferred" solution (with ca. 8m/s at 500km). Even with a very badly posed boundary condition of 35m/s at 500km, which leads to unrealistically large speed values for large r, the solution converges to the preferred solution at about 240km. This solution is plotted below on a scale of 0-2000m/s.
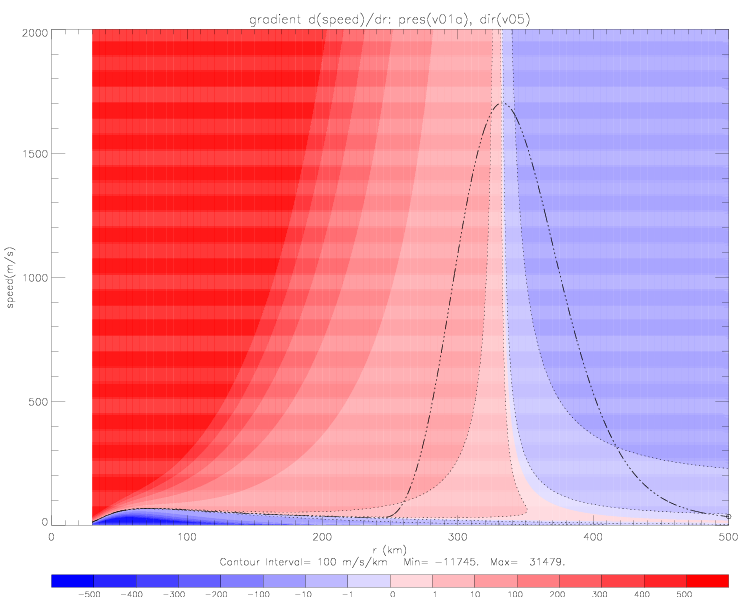
In all cases the numerical iteration is progressed (via Runge-Kutta) from right to left. For "realistic" boundary conditions (i.e. not too far away from the preferred solution), the numerical scheme converges relatively quickly. The contours of the speed gradient show the following (fig. 5.1.8): if the speed value at any point in the iteration (incl. at the boundary condition) is above the preferred solution, the gradient is less negative than for the preferred solution or even positive, so that it steers the numerical solution towards the preferred solution, when integrating from right to left:
If at some point in the iteration speed values fall below the preferred solution, the gradient for those speeds is much more negative than for the preferred solution, leading to a (dS/dr)i* · &Delta r that points very strongly "up" towards the preferred solution. Numerically, this scheme is very stable, and relatively independent from boundary conditions (within reasonable limits).
This equation cannot be integrated from left to right. No matter how high the numerical accuracy is in computing each iteration of Si, the computed values will always end up either slightly above or slightly below the preferred solution. If they are above, the gradients in those regions are always less negative than for the preferred solution or even positive, steering the next iteration even further away from the preferred solution towards higher speed values; and very quickly shooting towards infinite speed values. If a speed iteration falls below the preferred solution, the gradients are always much more negative than for the preferred solution, steering the next iteration even further away from the preferred solution into regions of smaller speeds; and eventually towards zero.
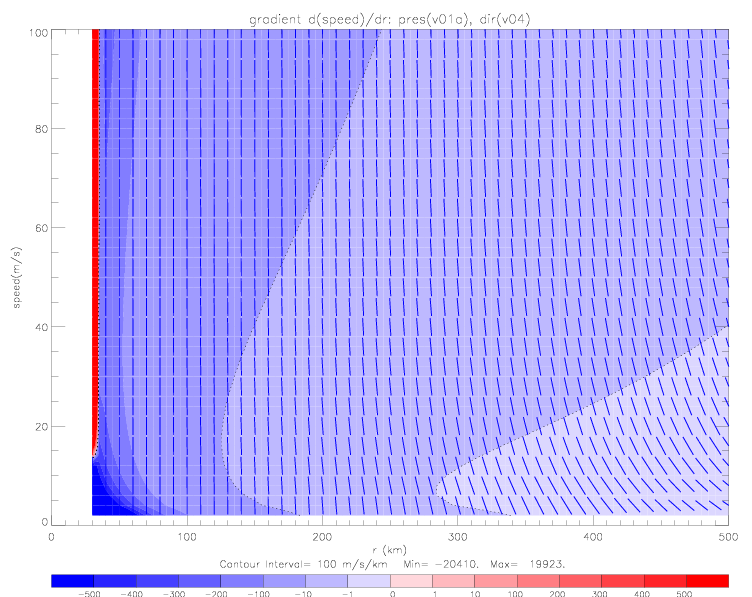
When using version v04 functional fit for wind directions (&theta = d1 + d2 · ( r / d3 ) d4) , which were derived from drifter observed wind directions, the resulting speed gradients are pictured below. It appears that no solution to the radial momentum equation is possible with this function: the gradient is steeply negative for almost all values of r.
The functional fits used above for relative wind direction (v04 or v05), do not take into account the speed of the hurricane due to its movement from south-east to north-west across the deployed drifters. During the encounter with the drifters the hurricane moved at a speed of about 6m/s (9/4/-9/5/2003). The "south-east" drifter data used to derive functional fits for pressure and relative wind direction, originate from the south-east region of the hurricane, when plotted in a relative sense (see fig. 2.1.6). That means, the data were sampled as the hurricane was moving away from the drifters. In the current coordinate system for radial velocity U and polar velocity V, these velocity components are defined relative to the hurricane center, such that (positive) U points away from the center. The data indicate relative wind directions &theta > 90°, which means (negative) U pointing towards the hurricane. As the hurricane moves away from the drifters, they measure Uobs = Uhurr + Urel, where Uhurr is the U component in a stationary hurricane, and Umove is the speed of the hurricane moving away from the drifters (i.e. 6m/s). Since the drifters measure relative wind direction and not speed (which gets determined indirectly via the radial momentum equation), the observations get adjusted for Umove in the following manner:
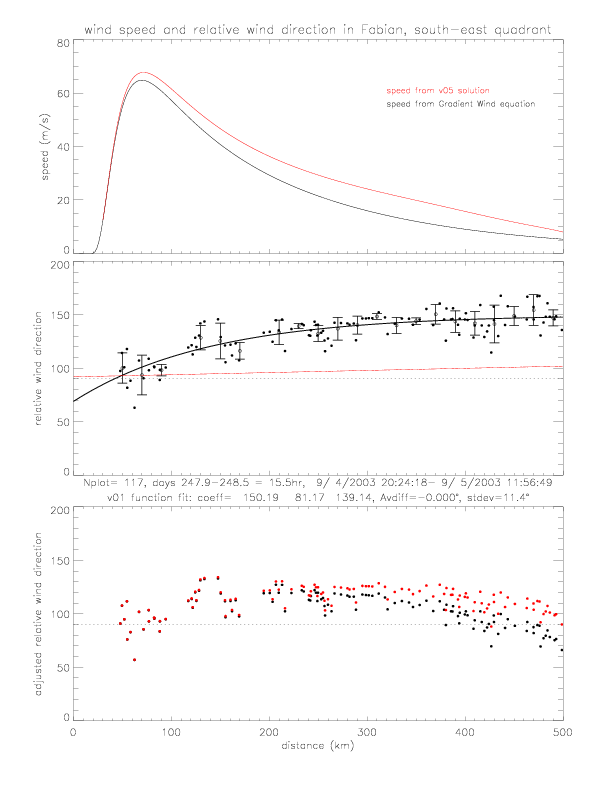
The following figures illustrate the adjustment of the observed wind directions. The top panel shows the speed solution of the Gradient Wind equation (in black), as well as the solution with v05 specified wind directions (in red) from fig. 5.1.6 The central panel shows the observed relative wind directions with v01 functional fit (in black), and also the v05 wind direction function, i.e. &theta = 92° + 10°/500 · r (in red). The bottom panel shows the adjusted wind directions: using either the Gradient Wind speeds (in black) or the speeds from v05 solution (in red). The biggest differences of the two adjusted directions occur at larger distance, when observed directions are lareg and the speed is relatively small.
A functional fit can be computed for the adjusted wind directions (derived with v05 wind speeds), using the following function:
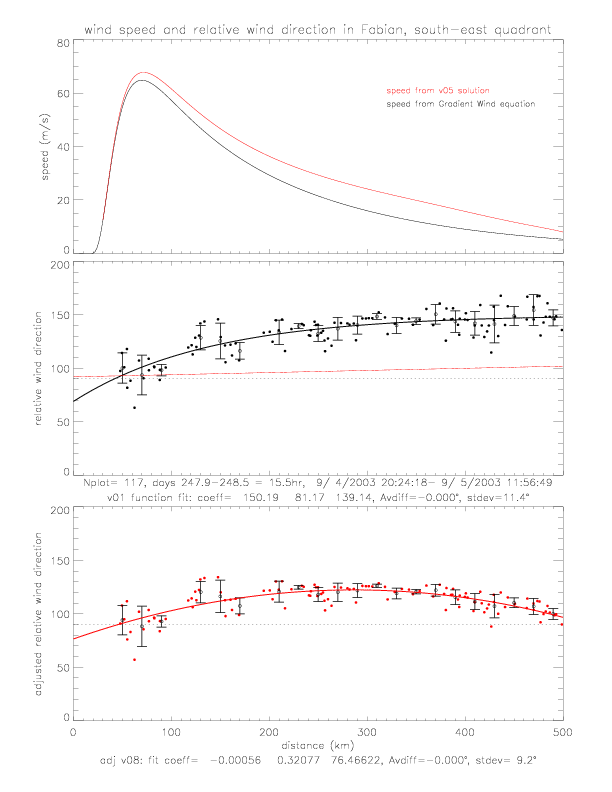
Adjusted wind directions are used as input for the radial momentum equation. The next plot shows the resulting speed gradients and the solution: it starts with reasonable speeds at large distances (smaller than in the case of Gradient Wind speeds, as well as v05 wind speeds), but eventually blows up at about 280km where the gradient changes from mostly positive to negative everywhere.
At large distances (where this solution is stable, and has reasonable wind speed results), the computed speeds are much lower than the wind speeds from the Gradient Wind solution, as well as v05 solution. For example, at 350km, this solution has a speed of ca. 5m/s, while the Gradient Wind solution is 12m/s, and v05 is 20m/s. Now the wind direction adjustment can be repeated with smaller wind speeds. As a first step, it is assumed that for r>350km speeds are about half as high as Gradient Wind speeds; and for smaller r, the ratio changes linearly from 0.5 to 1.0 down to r=70km, where the wind speed reaches a maximum of 65m/s.
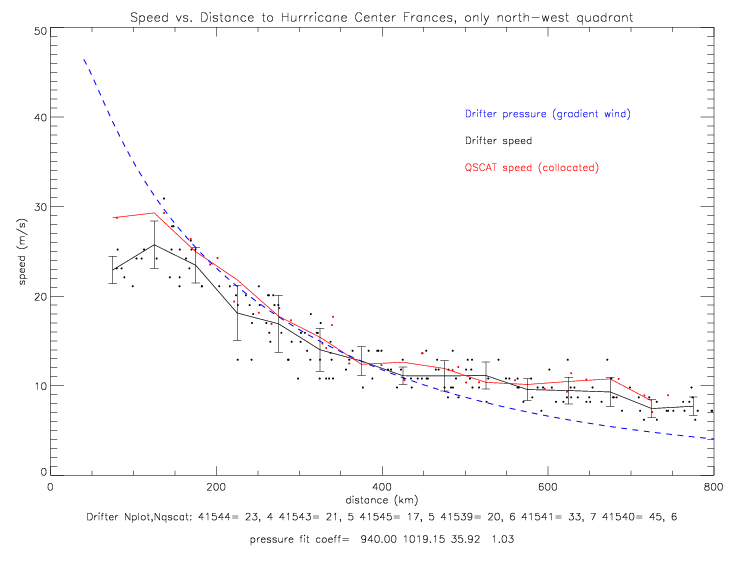
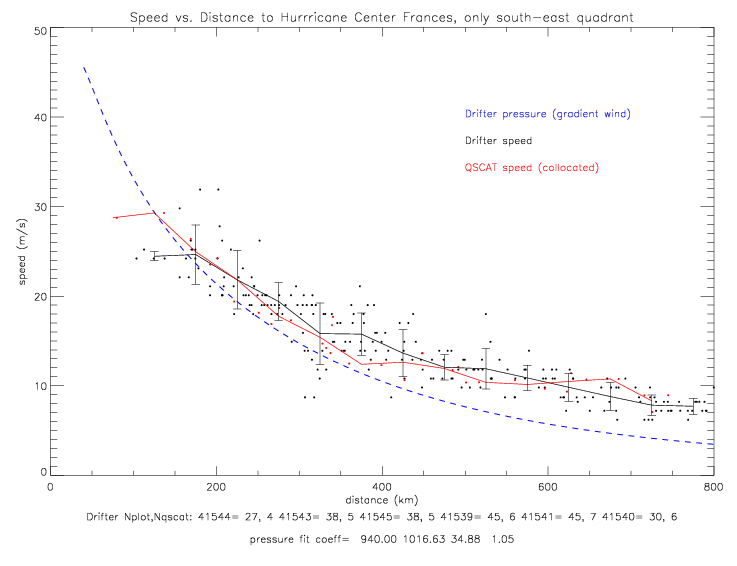
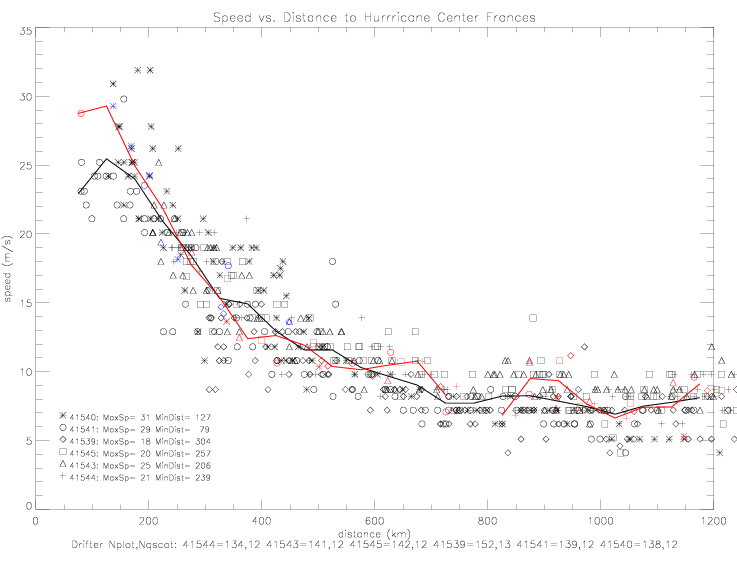
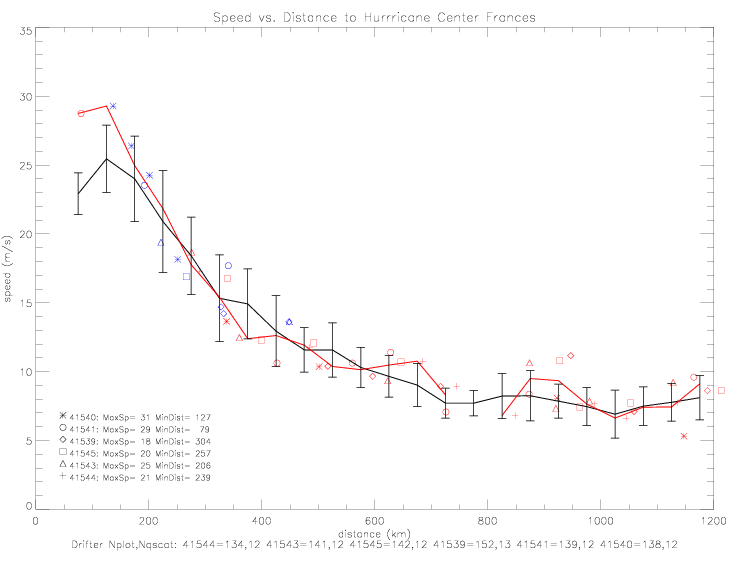
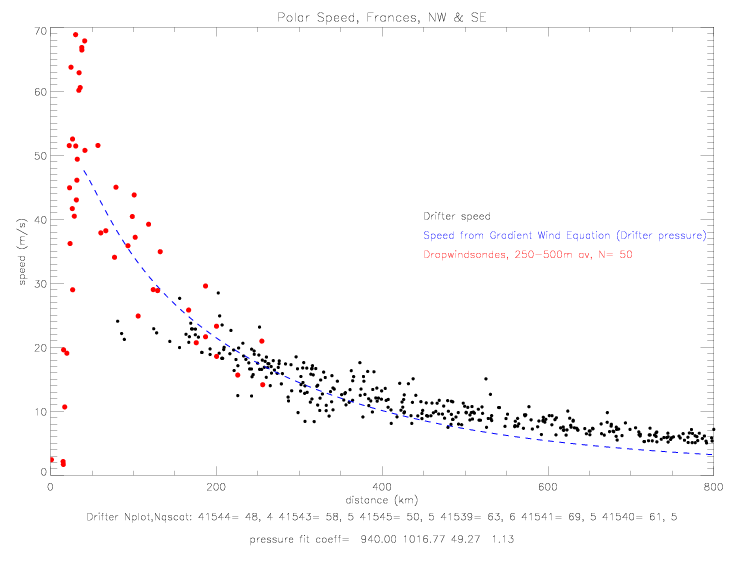
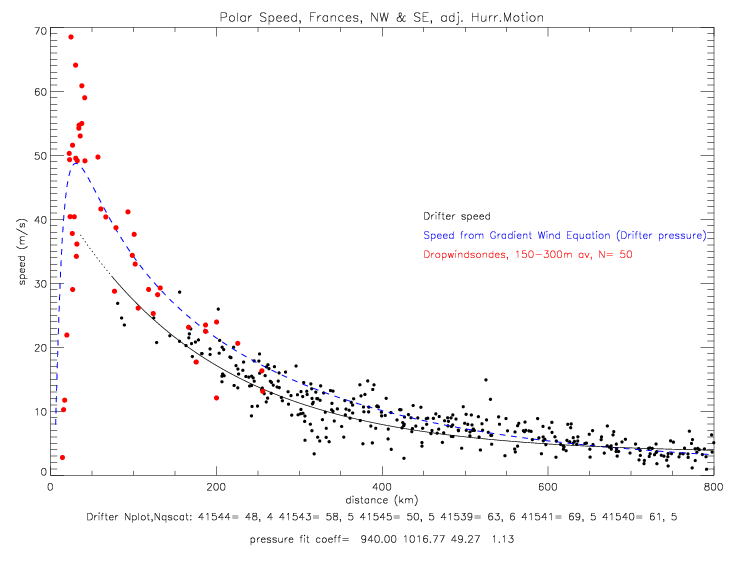
In all the next figures of wind speed, the drifter speed data have been corrected by offsets with respect to QSCAT collocations (see Table 8.1 of METOCEAN wind speed corrections in Frances). Drifter speeds adjusted for the hurricane motion (see fig. 4.2.7 -4.2.11) are shown next. The gradient wind solutions shown in the figures are all different from each other, because they were derived from the different data sub-sets.
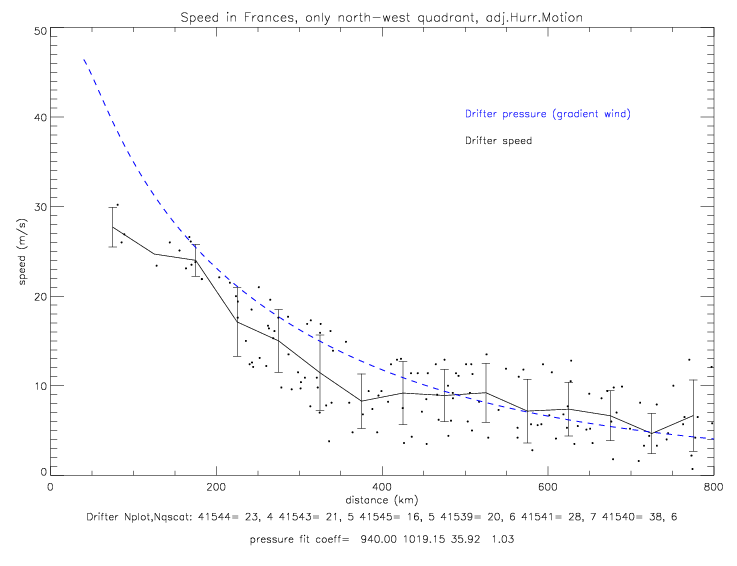
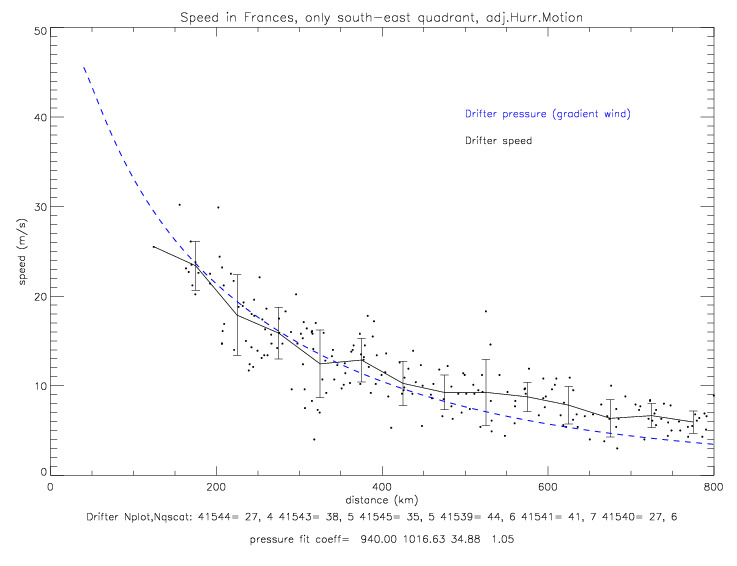
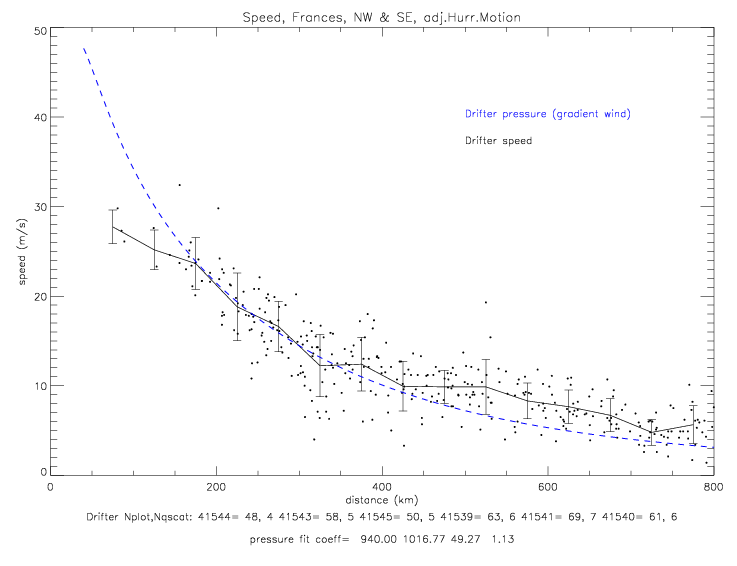
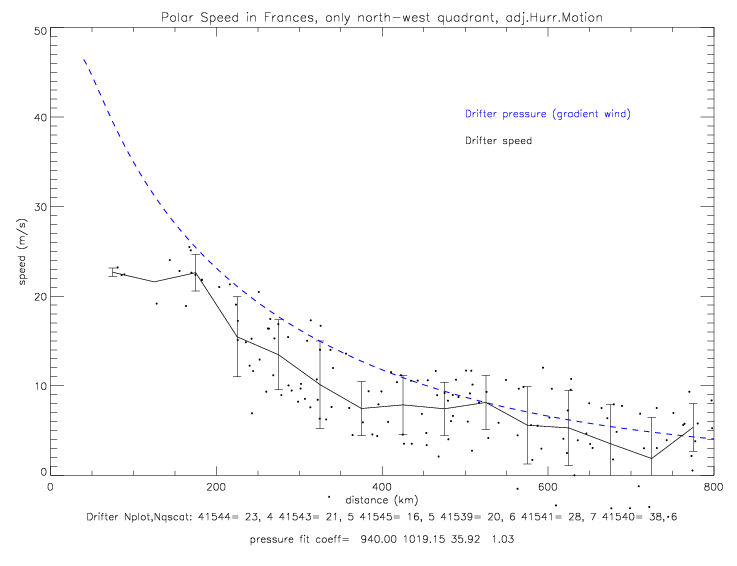
The cyclostrophic equation is used to derive the polar wind speed (not total speed). So when plotting cyclostrophic speed and drifter speeds, only the polar component of the drifter observed speeds should be shown. This is done in the next figure.
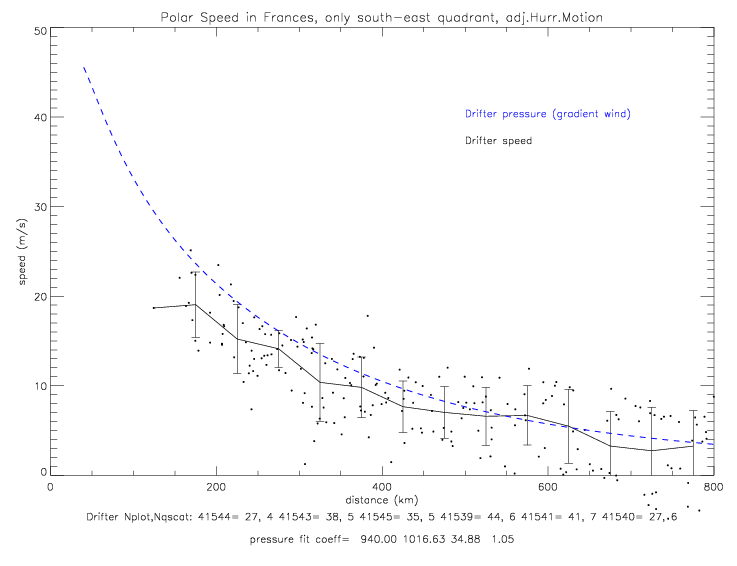
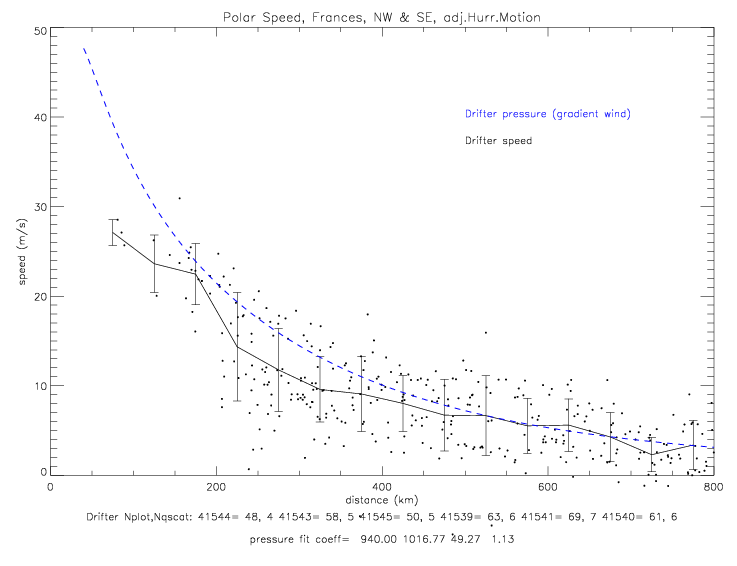
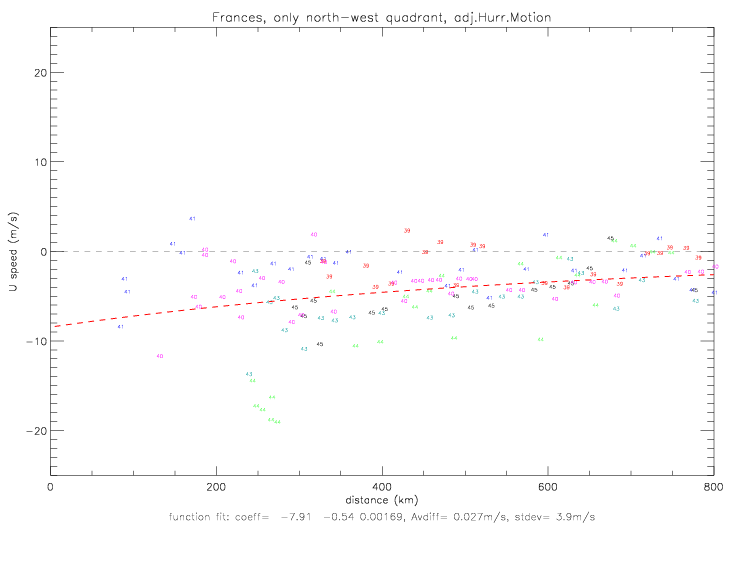
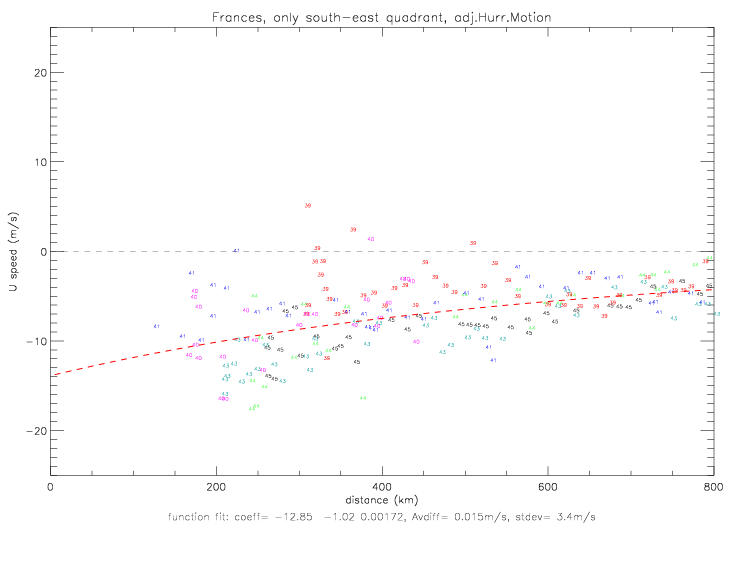
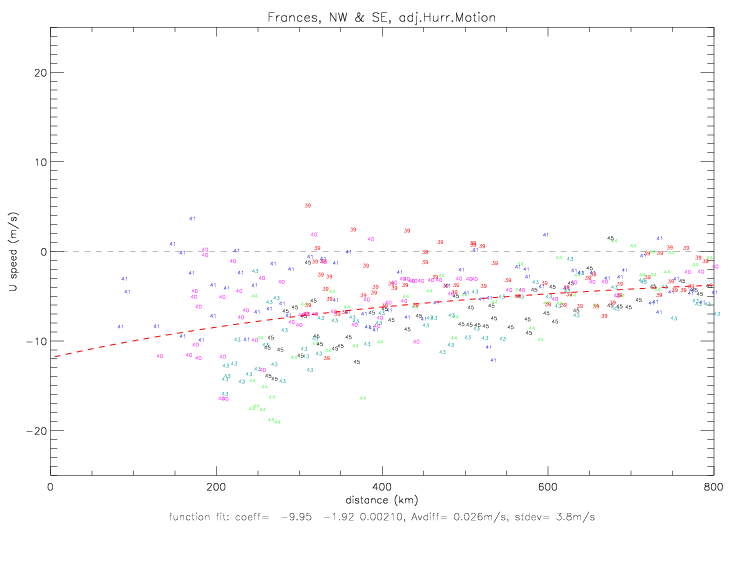
Taking the drifter observed wind speed and relative wind direction, allows for the computation of the vector components U (radial component) and V (polar component). Figure 5.2.4 shows observed relative wind direction (same data as in figs. 4.2.9(b), 4.2.10(b), and 4.2.11), except in the next figures each data point is denoted with the last two digits of the Metocean drifter ID. The linear fit for relative wind direction is dir = c0 + c1*dist(km).
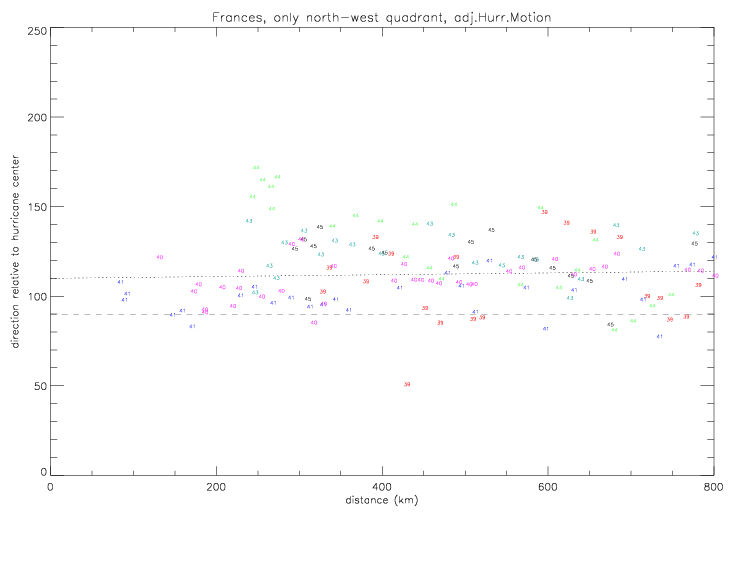
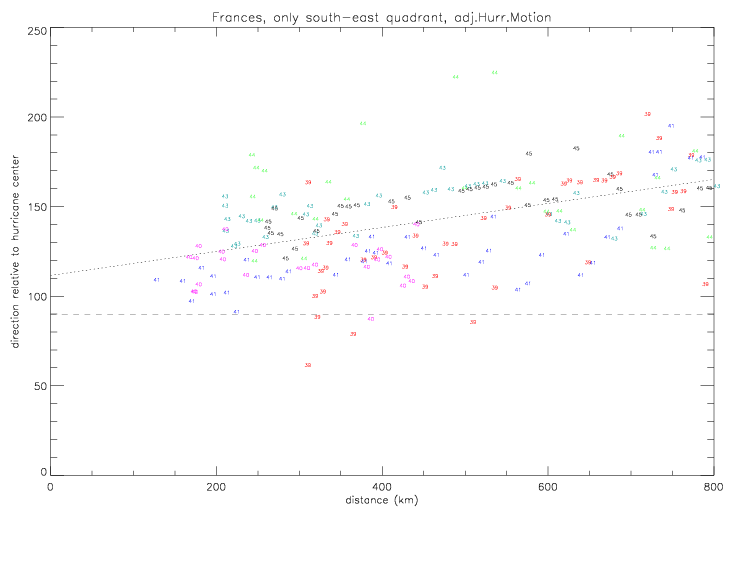
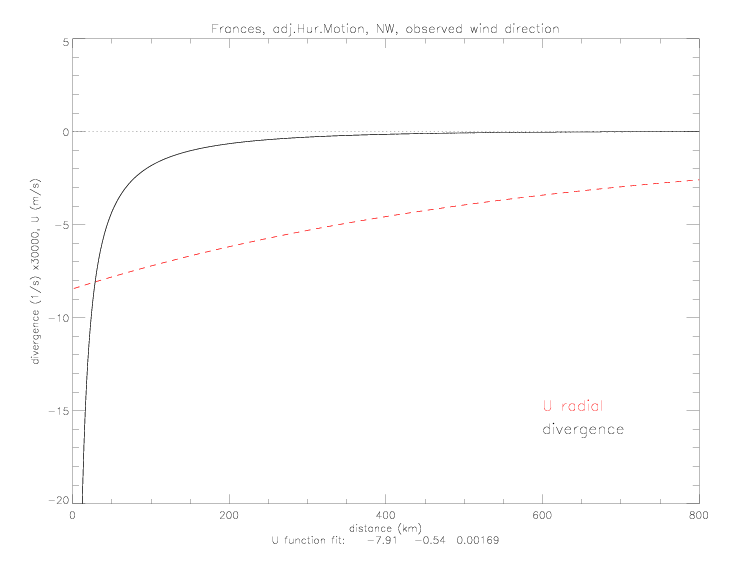
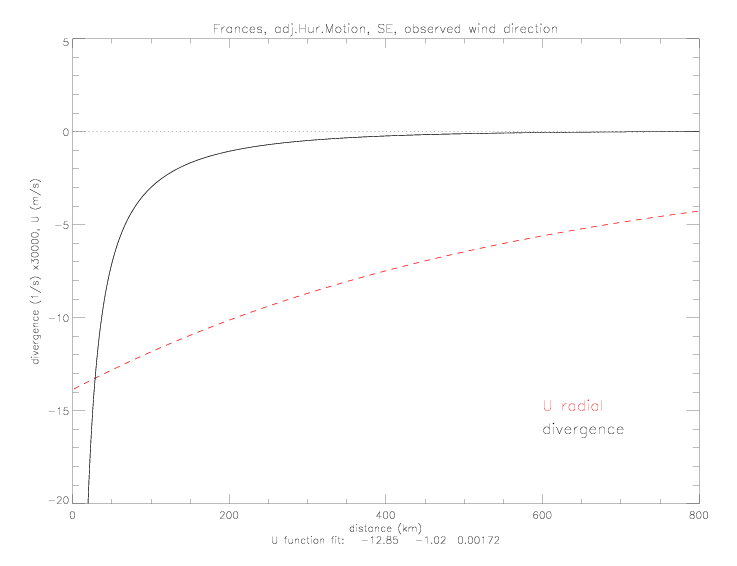
Next are shown the resulting radial components, U, either computed from observed speed and relative wind direction (fig. 5.2.5), or computed from speed and the linear fit to the relative wind direction (fig. 5.2.6). A curvefit for the radial speed is computed for the following function:
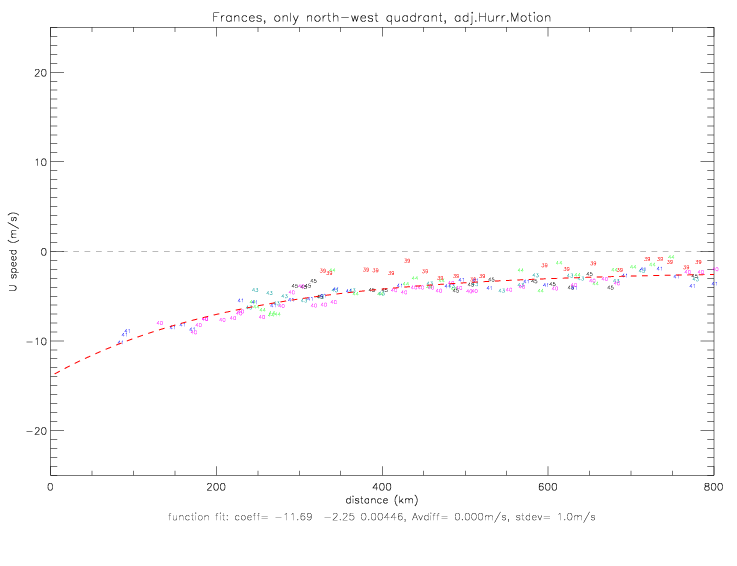
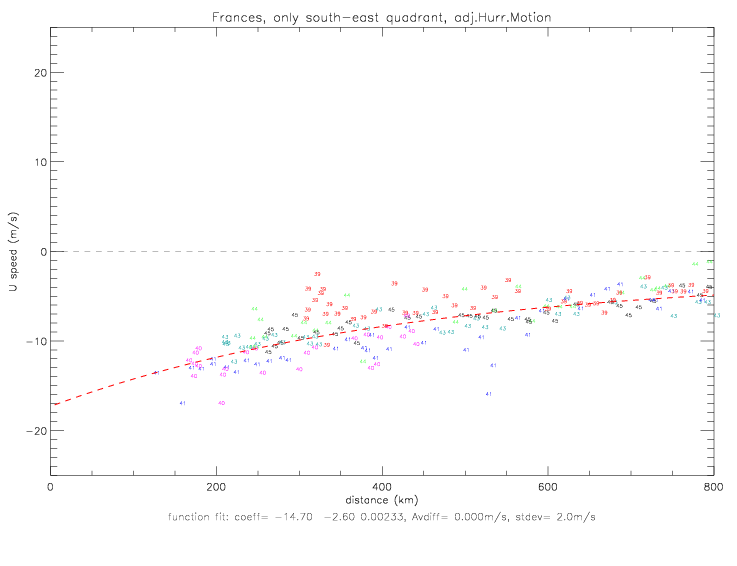
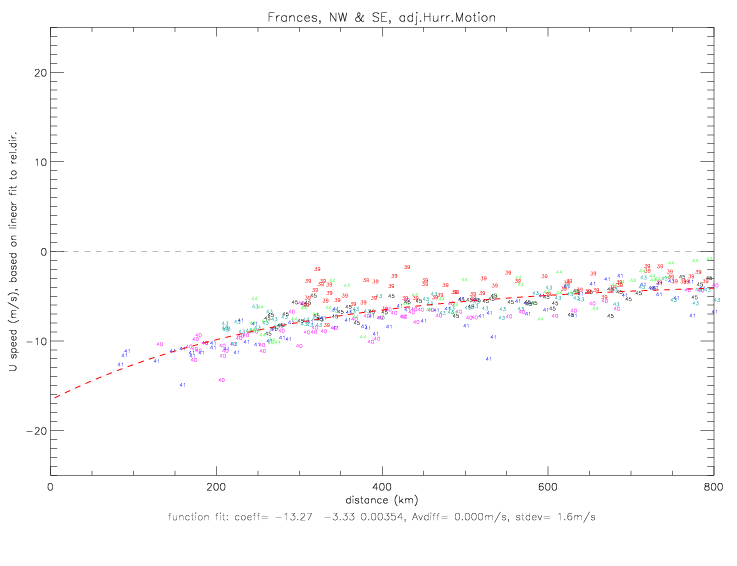
Based on the radial speed, the radial divergence can be computed as
Next the polar components are computed from wind speed and direction. Wind direction is either the observed value, or the value derived from the linear fit to the wind direction. The curvefit function for V is the same as the one used for U:
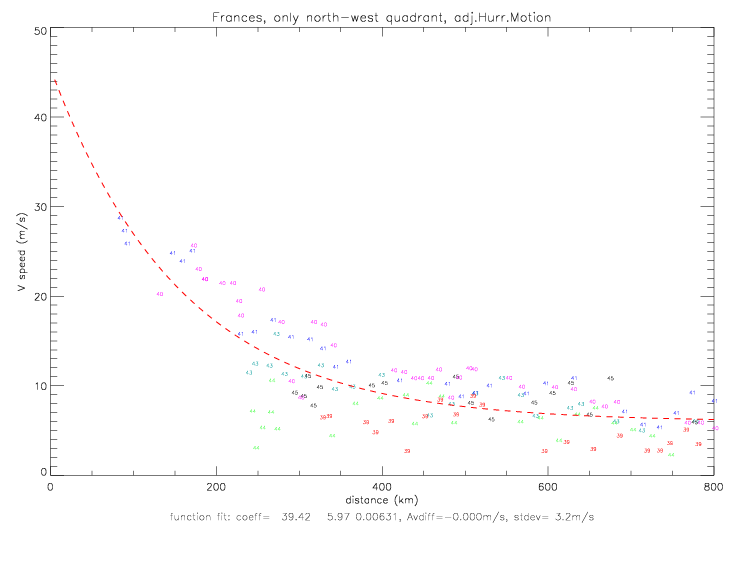
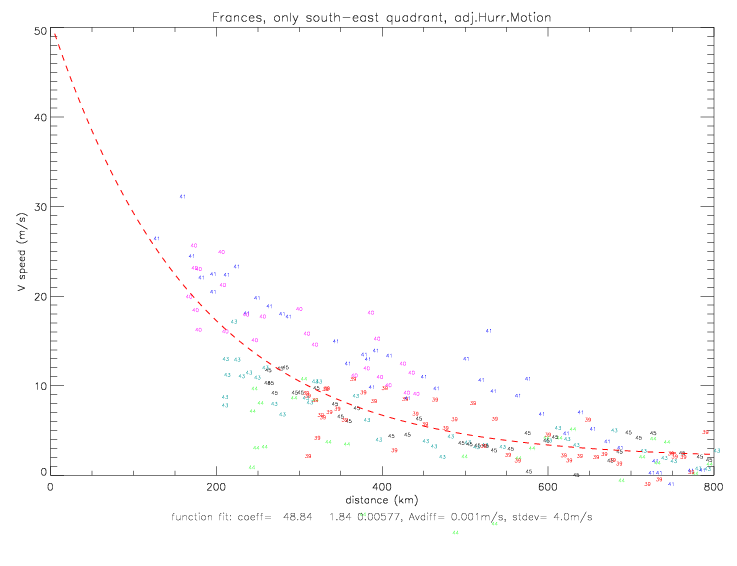
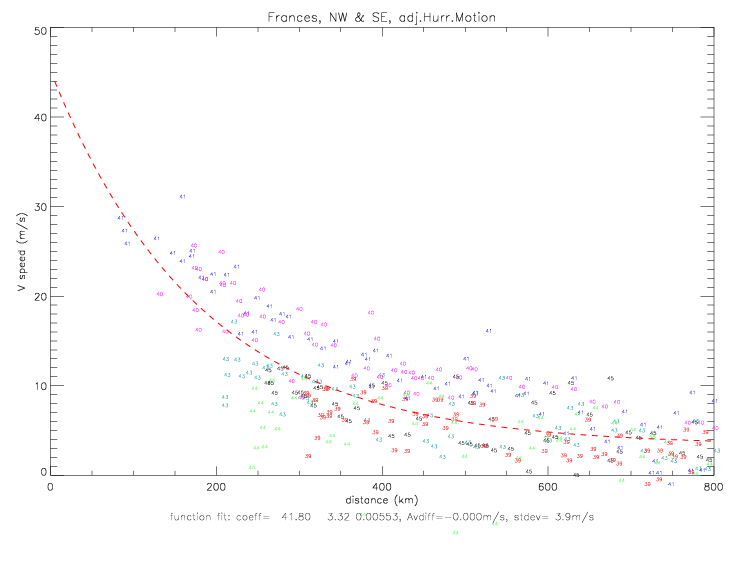
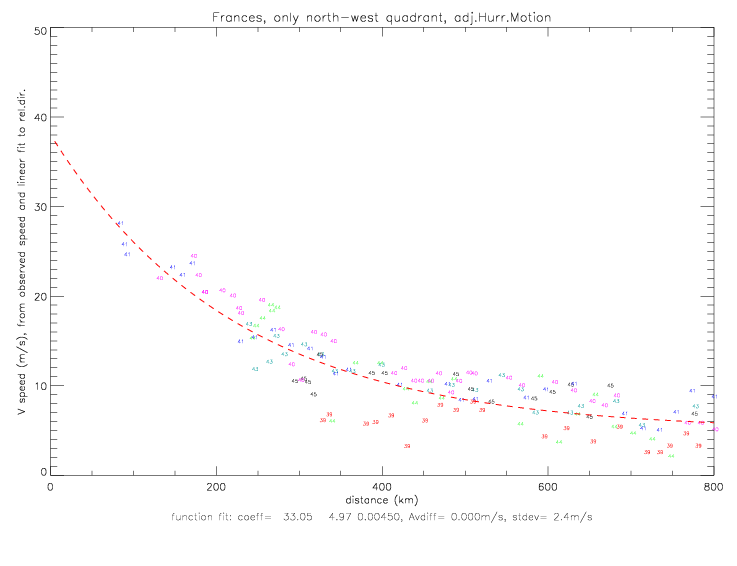
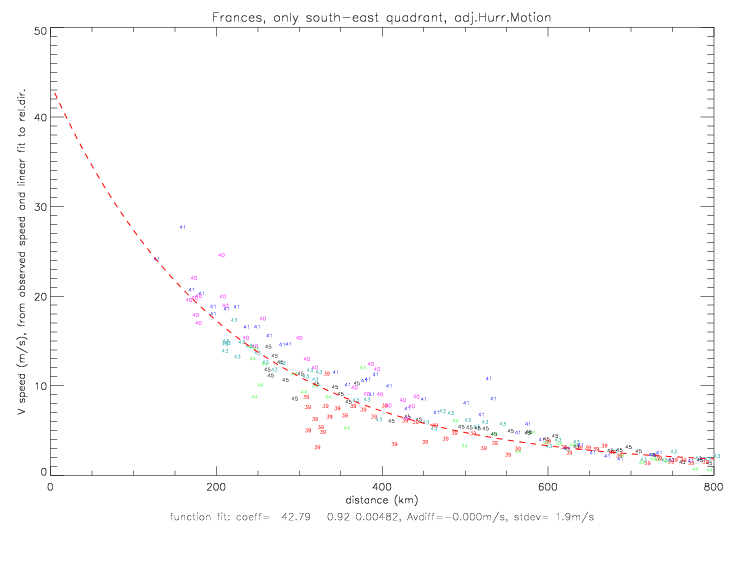
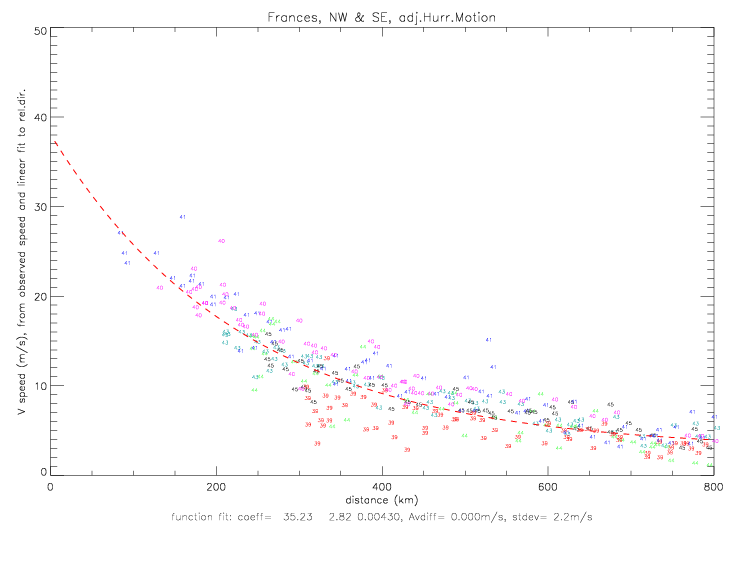
Now a small modification to the Gradient Wind Approximation (equation E.3) is computed by including the UdU/dr term from the radial
momentum equation (equation E.1):
For this calculation, curvefits for pressure (coefficients from all quadrants in fig 2.2.5) and U (coefficients from all quadrants, using linear fit to relative wind directions in fig 5.2.6(c)) are specified as follows. The fits for the north-west and south-east quadrants use slightly different coefficients calculated from pressure and U in only those quadrants. For the calculations of the combined quadrants, the coefficients are as follows:
The solution to the modified gradient wind equation follows as:
As an example, this equation is solved at r=100km (with p=998.56mb, U=12.8m/s, f=6.4 10-5s-1, ρ=1.29kg/m3):
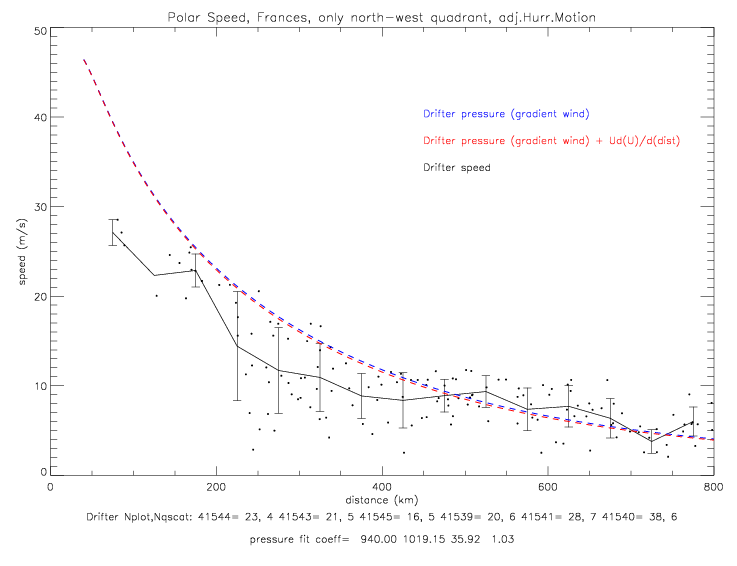
In the next figure, the original solution to the gradient wind solution is plotted in blue, and the modified solution in red. The modified solution is a little smaller than the original solution, because U is negative, the gradient of U=dU/dr is positive, so that r · U · dU/dr is negative. At r=100km the modified solution for the combined NW&SE quadrants is only ca. 0.6m/s smaller than the gradient wind solution. First are shown the solutions with the observed relative wind directions used to compute U, and then with the linear fit to direction for U. Those solutions are not very different from each other because the U fits are very similar (for observed and linear fit wind directions).
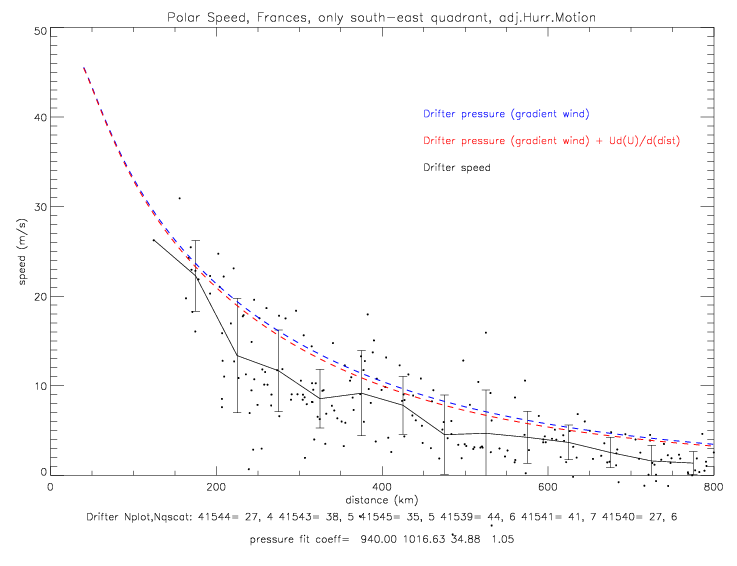
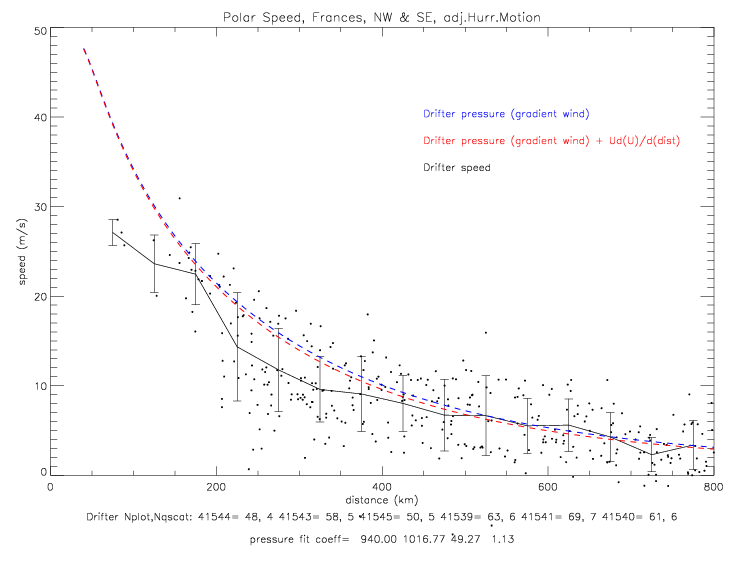
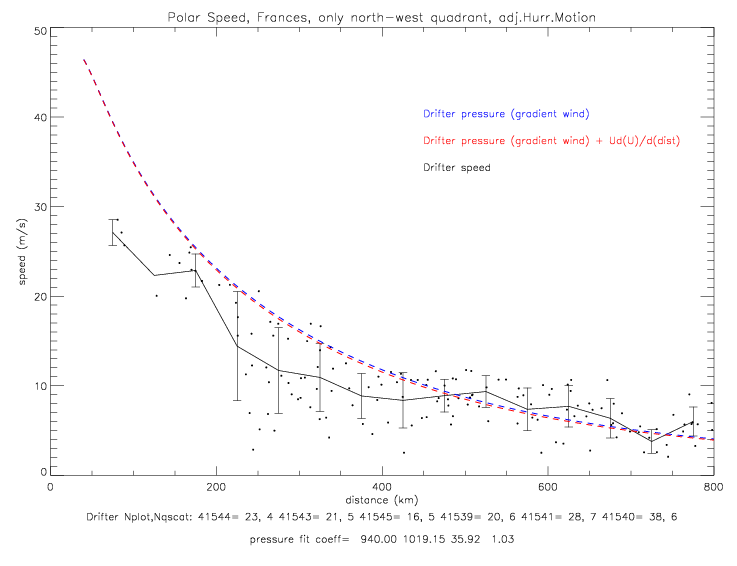
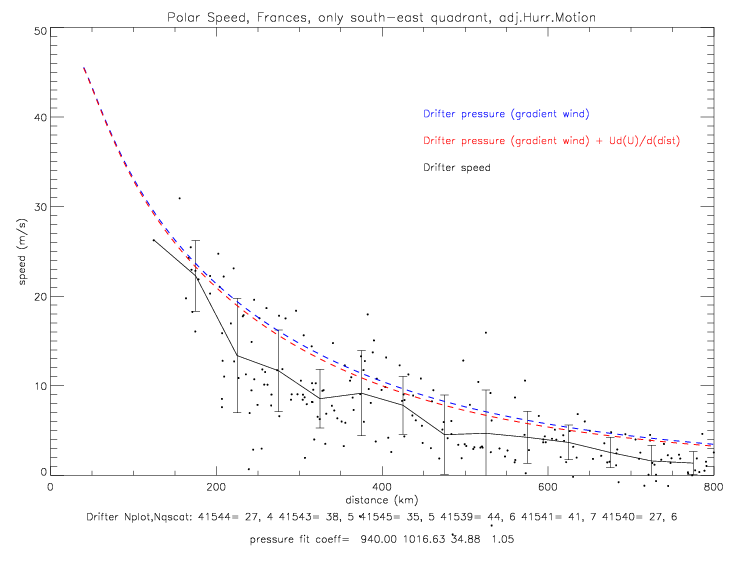
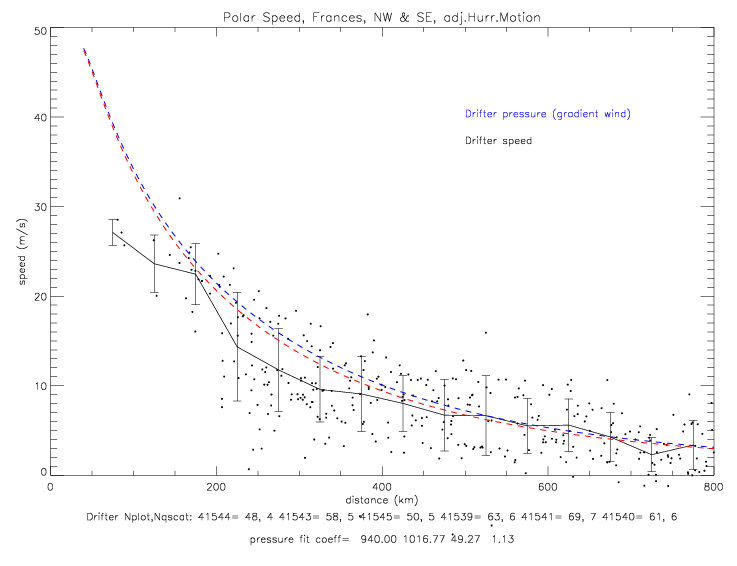
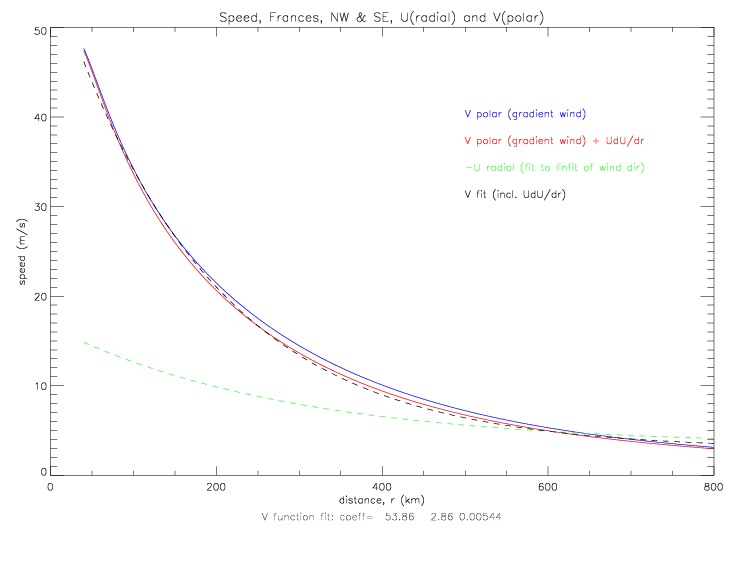
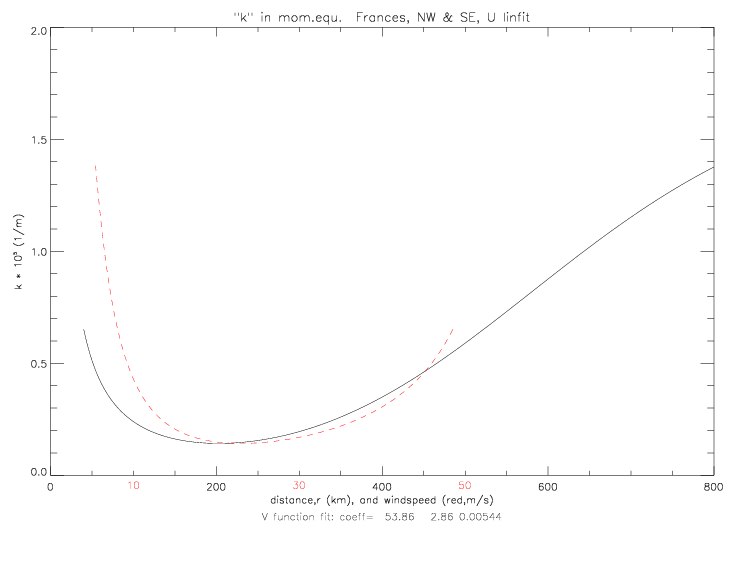
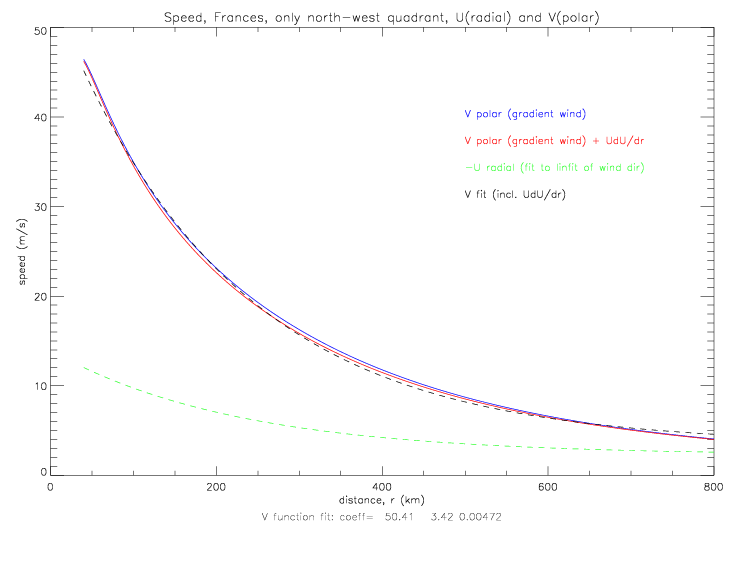
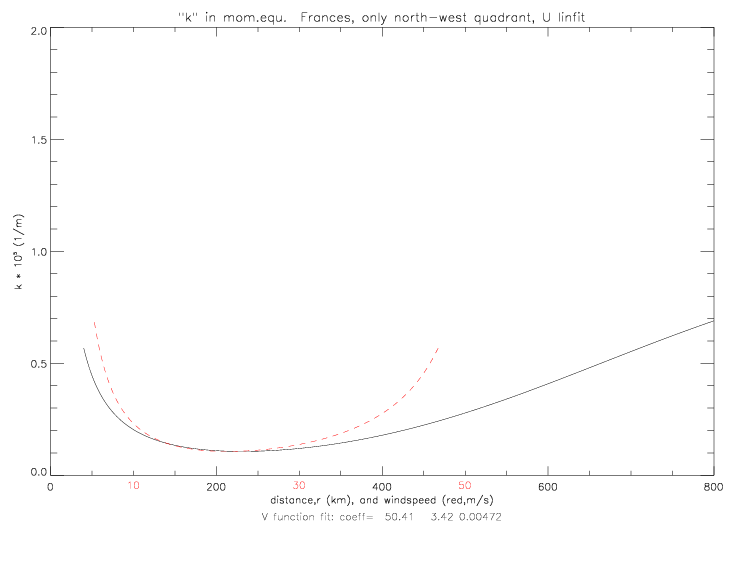
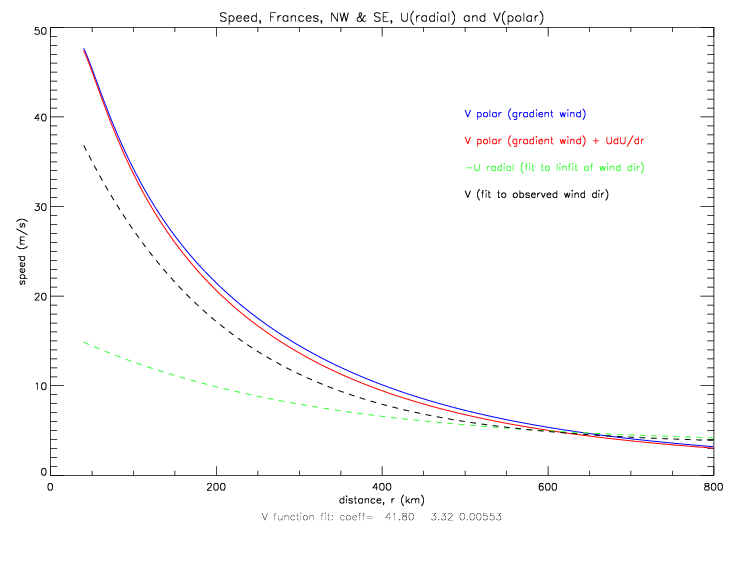
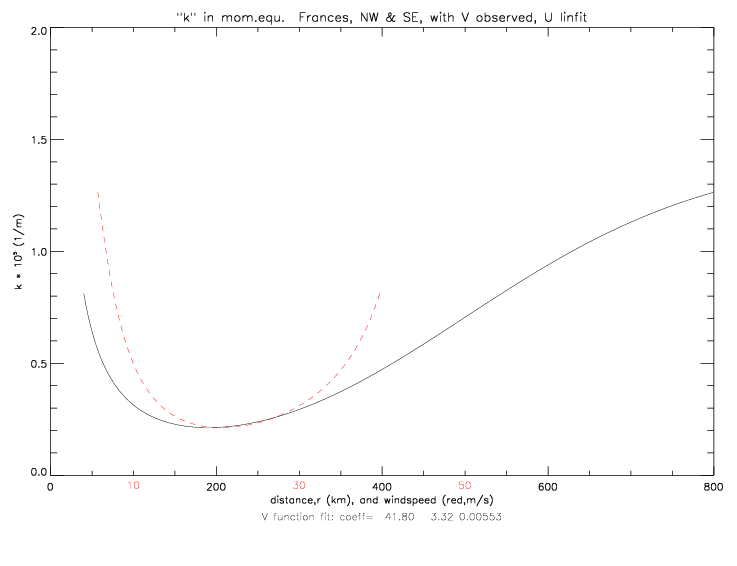
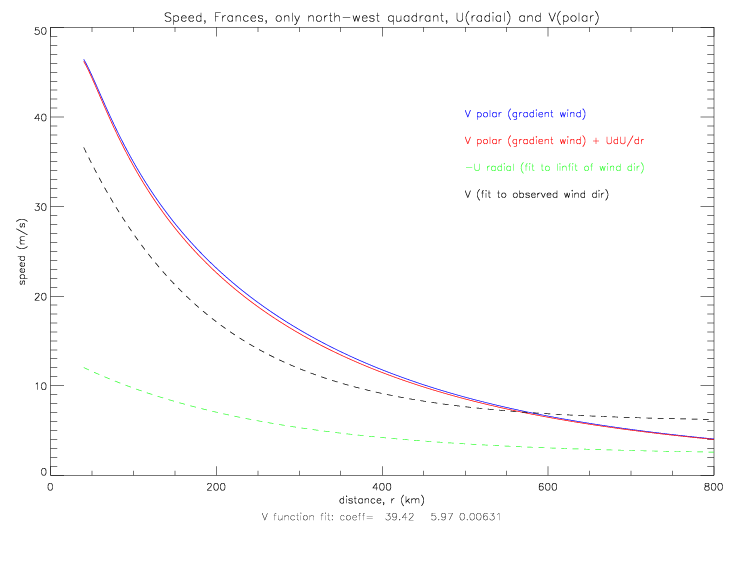
V can also be derived from a fit to observed wind speeds (and either observed wind directions, or the linear fit to wind directions, see figs. 5.2.7 and 5.2.8), instead of taken from the solution of the cyclostrophic equation. The resulting k solutions are shown below.
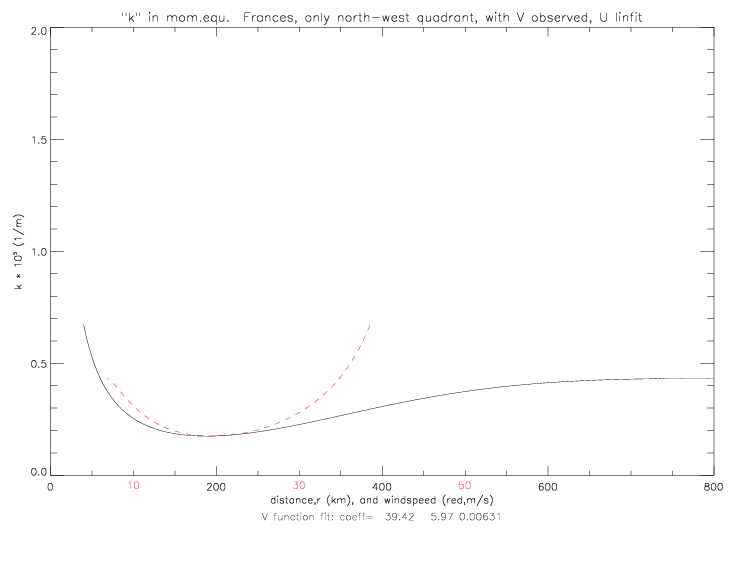
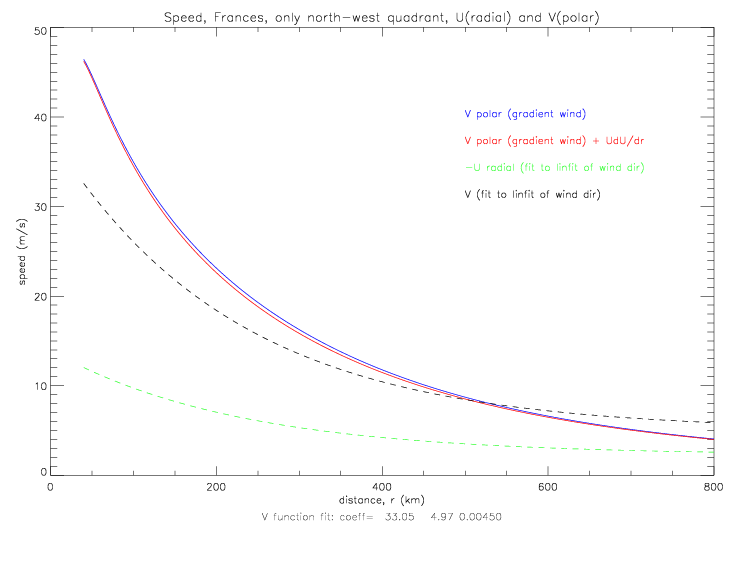
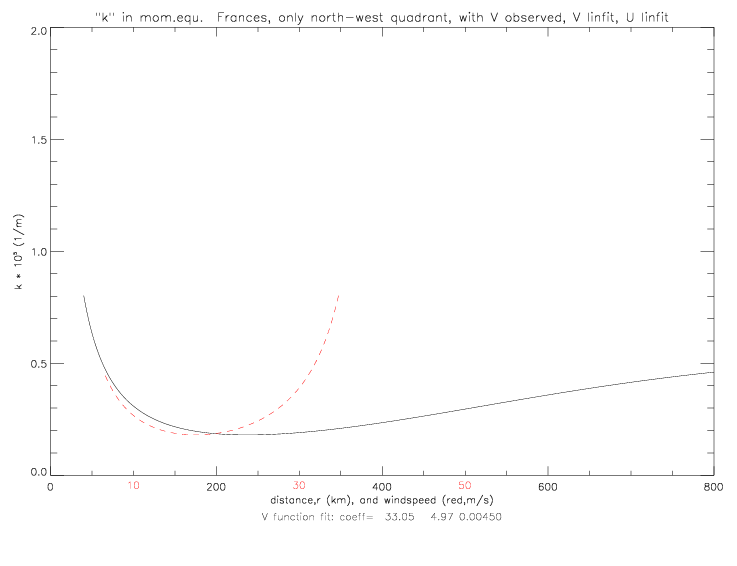
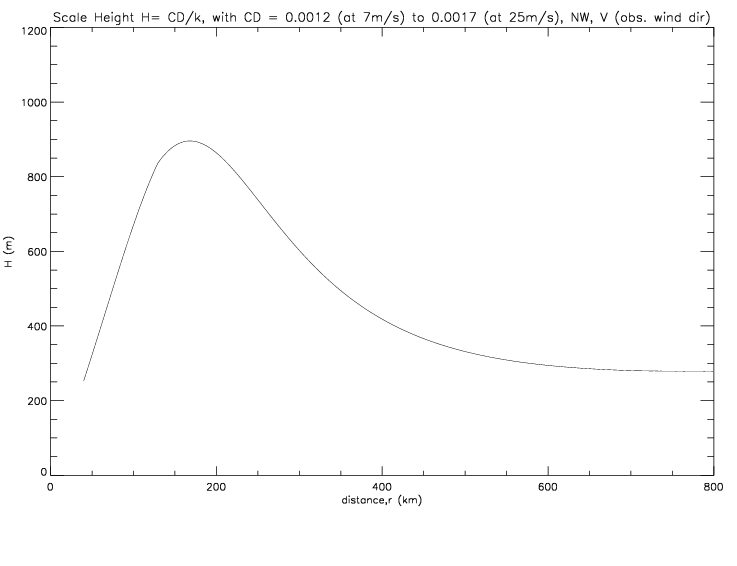
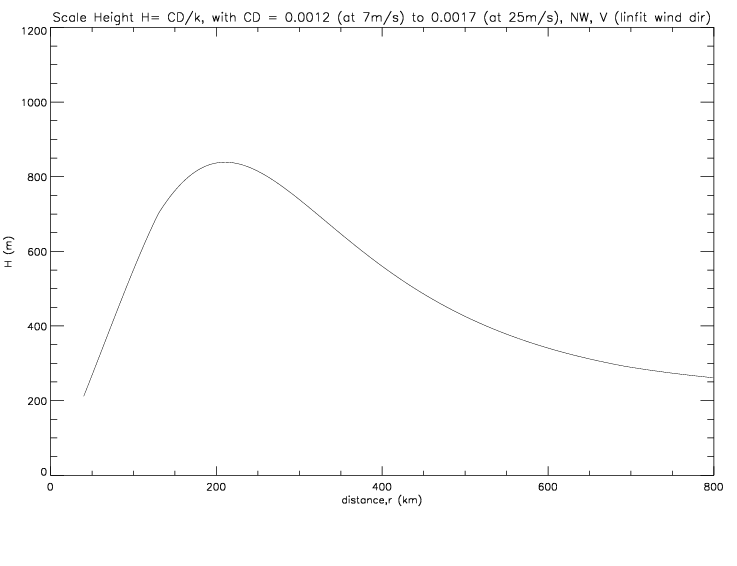
Given k as a function of distance, the scale height "H" can be calculated if the drag coefficient CD is known; H = CD / k. The drag coefficient is specified as follows:
In the following figures, H is plotted when azimuthal (or polar) speed, V, is derived from a fit to observed total speed and either observed directions (with V and k as in fig. 6.2.4) or a fit to observed directions (fig. 6.2.5), using data from the northwest quadrant only. H varies from 250m (at large distance) to 900m at 150-200km.
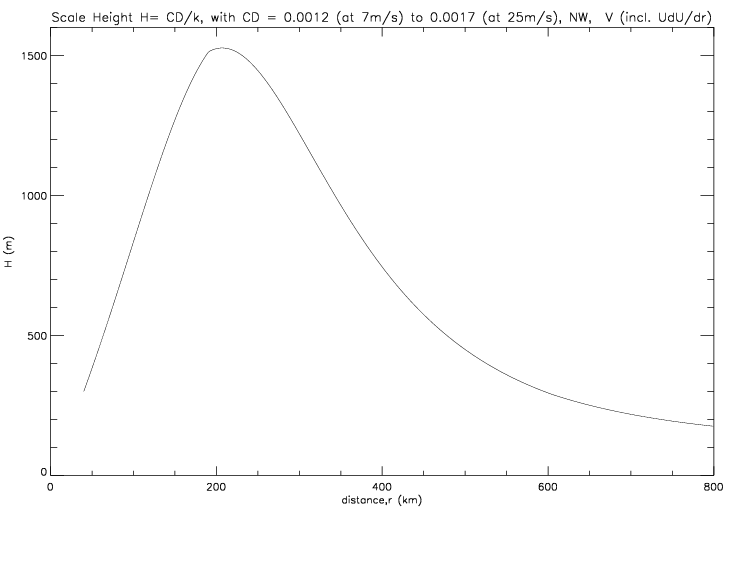
If the the scale height is derived from the solution to the gradient wind equation (incl. the UdU/dr term, as in fig. 6.2.2), then it takes values between 200 and 1500m, as shown in the next figure.
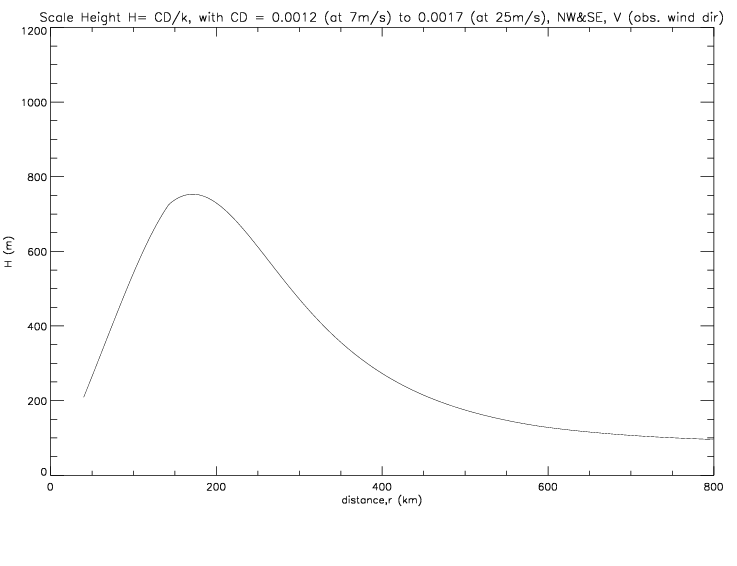
When combining NW and SE quadrants, using V from observed wind directions, as in fig. 6.2.3 results in the following scale height:
Several variations of the drag coefficient as a function of wind speed are illustrated below, with resulting scale heights:
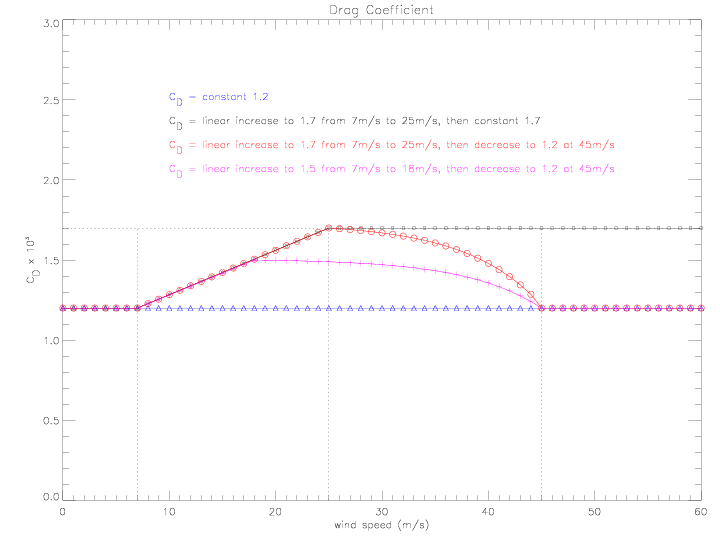
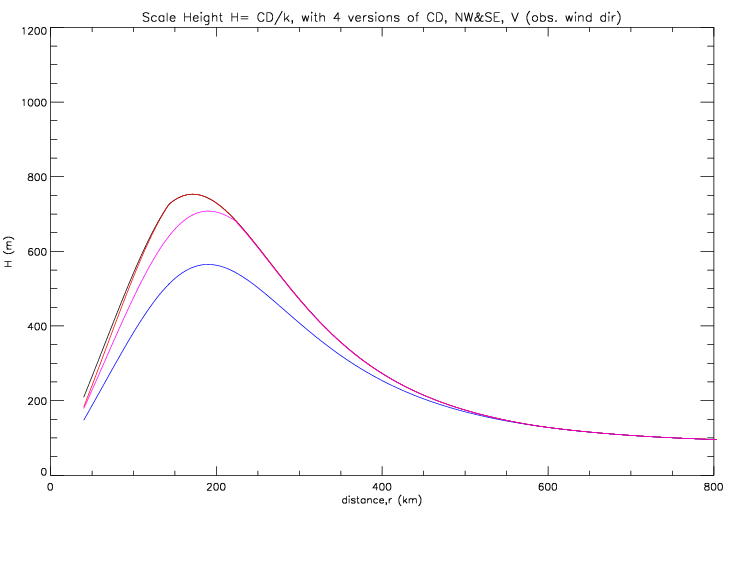
Two more variations of the drag coefficient are illustrated below, in addition to the constant and linear increase from above:
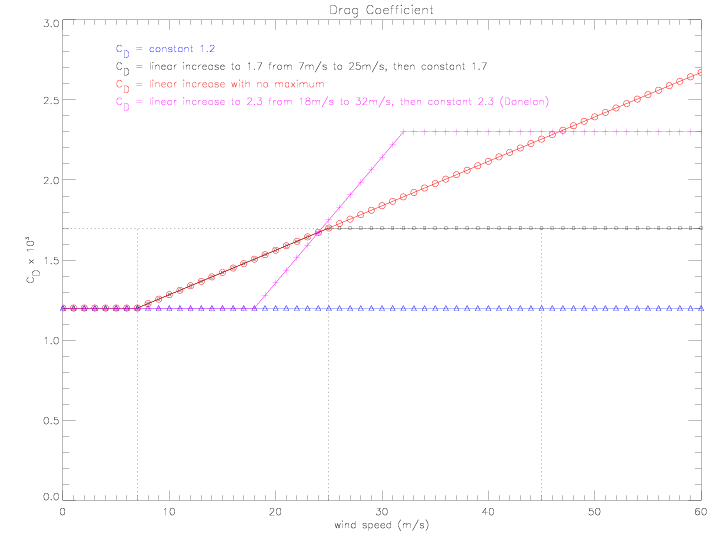
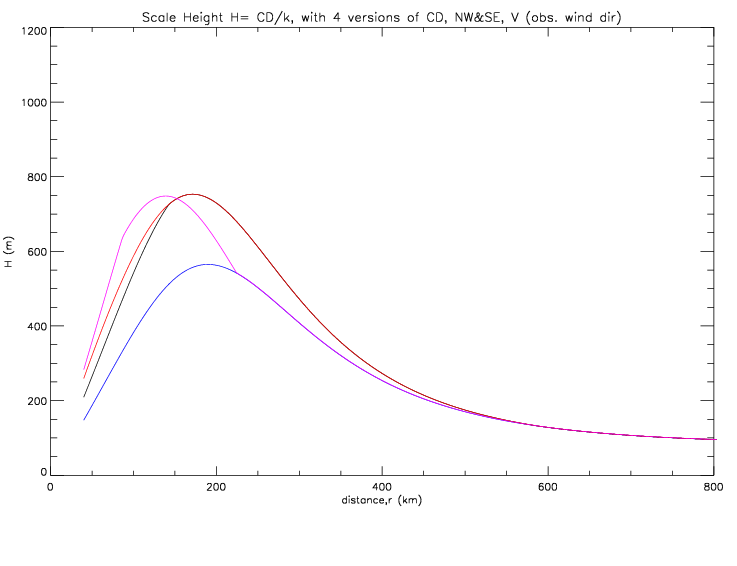
The contribution of another additional term in the radial momentum equation is now considered, namely the addition of - k · speed · U , or - CD · speed · U / H . Equation (E.4) changes as follows (the UdU/dr term is shown in red):
As with equation (E.4), the terms in this equation are evaluated for data from the combined NW&SE quadrants, at r=100km, with p=998.56mb, observed U=-12.8m/s, and observed speed=sqrt(12.82+272) = 30m/s, CD = 0.0017, and H = 540 m:
For comparison, the terms for the gradient wind solution and the UdU/dr modified solutions are listed as well:
Note that the observed azimuthal speed V is only 27m/s at 100km. The k-modified solution is shown below.
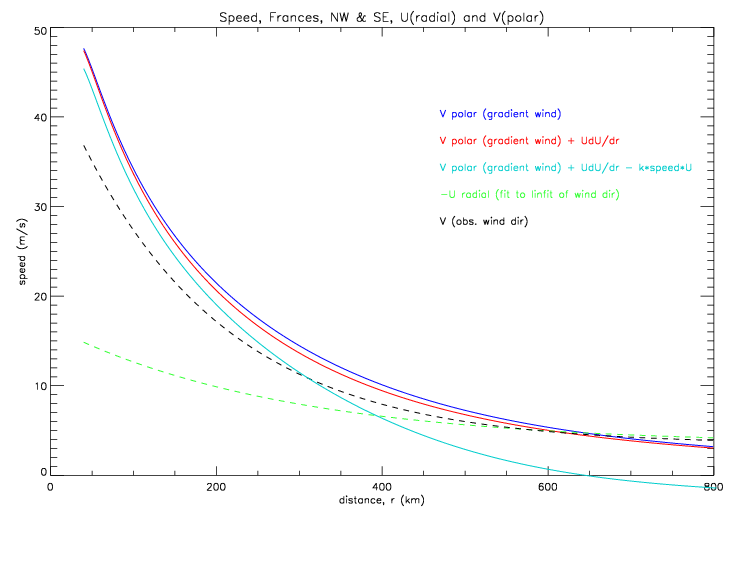
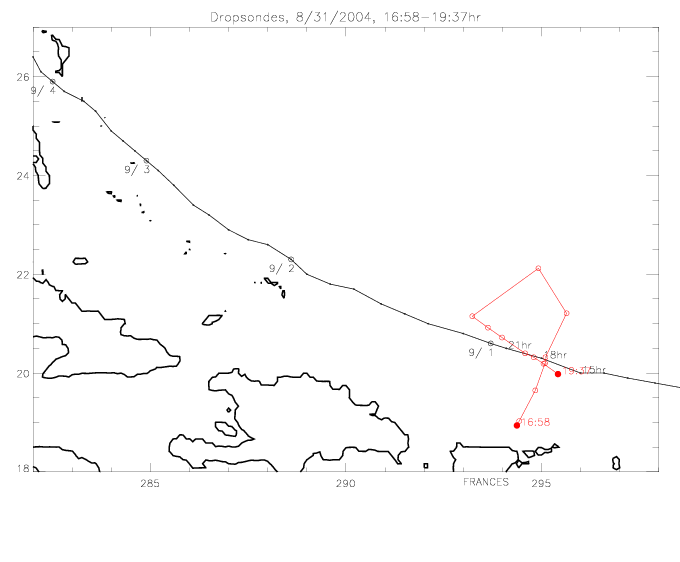
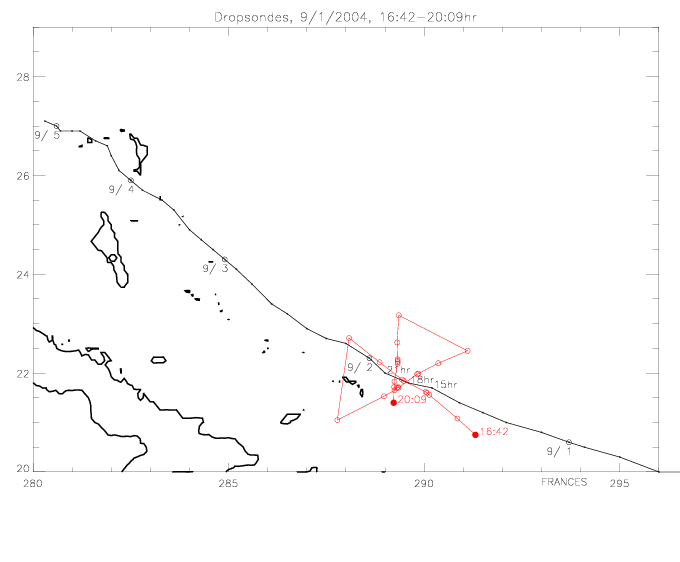
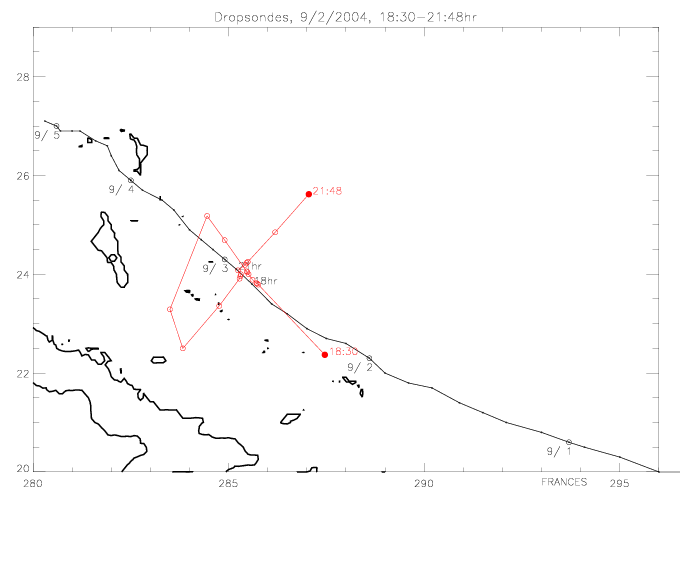
Here the dropwindsonde wind direction vectors are plotted with the drifter wind directions, relative to the center of Frances.
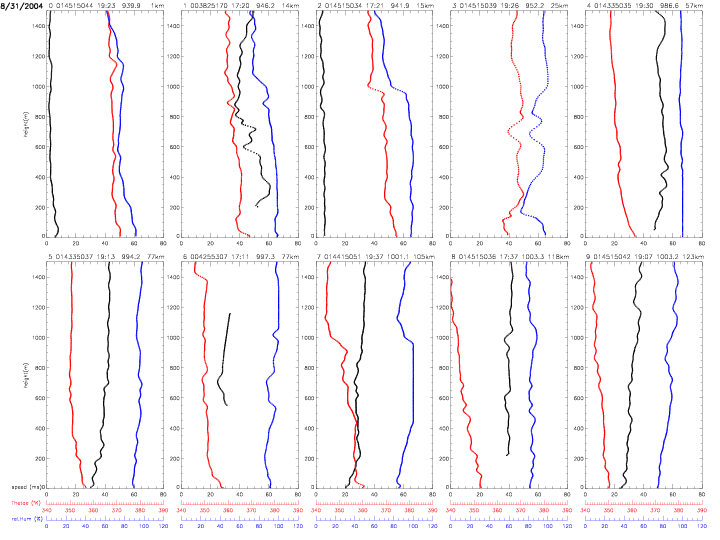
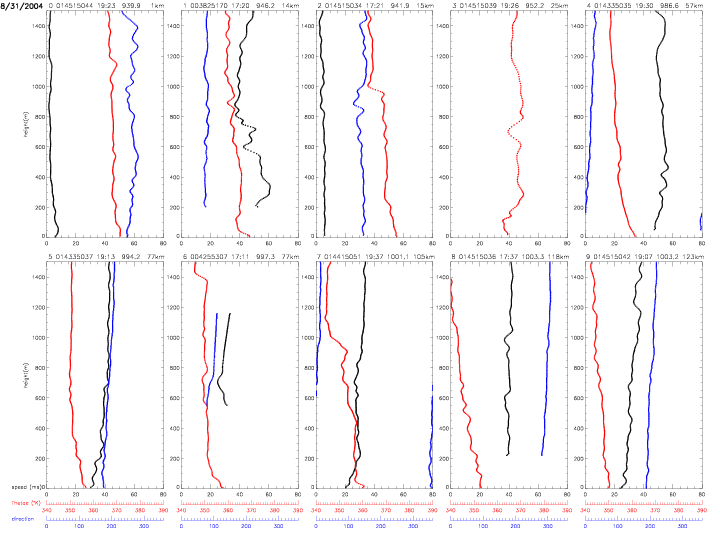
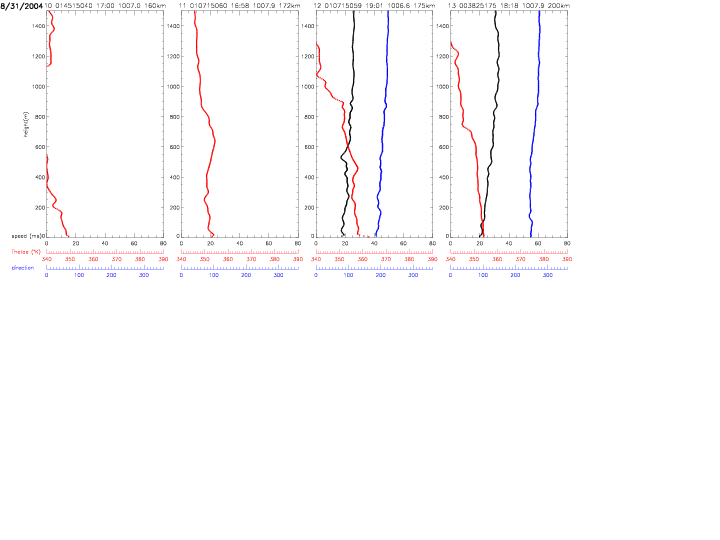
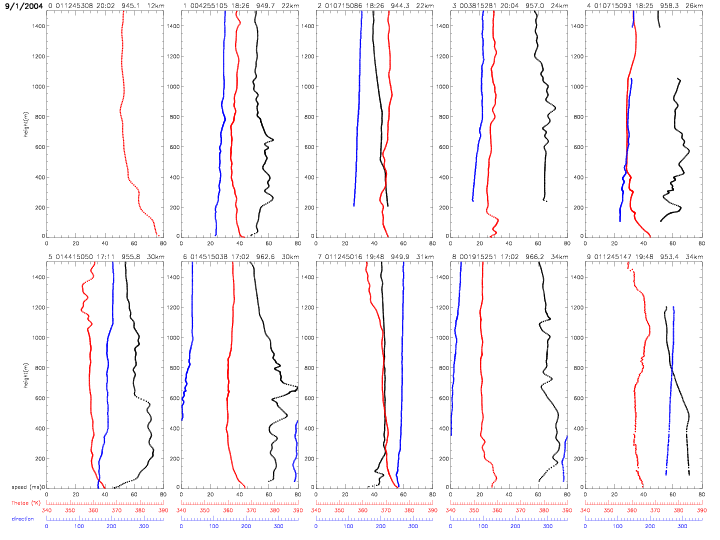
All individual dropwindsonde profiles are shown below. The vertical profiles are ordered by distance from the hurricane center. The label on top of each individual plot indicates: index (0-27) with respect to hurricane distance, dropwindsonde identifier, surface pressure (in mb) and distance (in km, from 12-205km). The scales for equivalent potential temperature (in red) and relative humidity (in blue) are indicated below the figures. The data are from the "Full-Resolution Data" (FRD) files, which represent the finalized, post-processed data from the Hurricane Research Division.
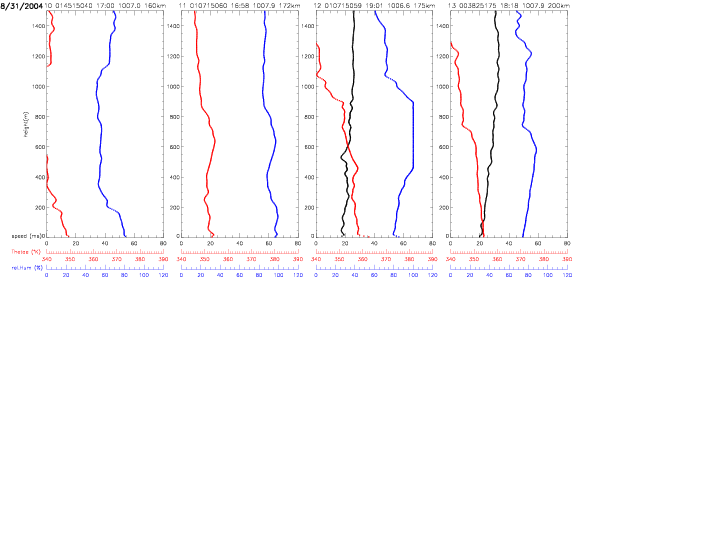
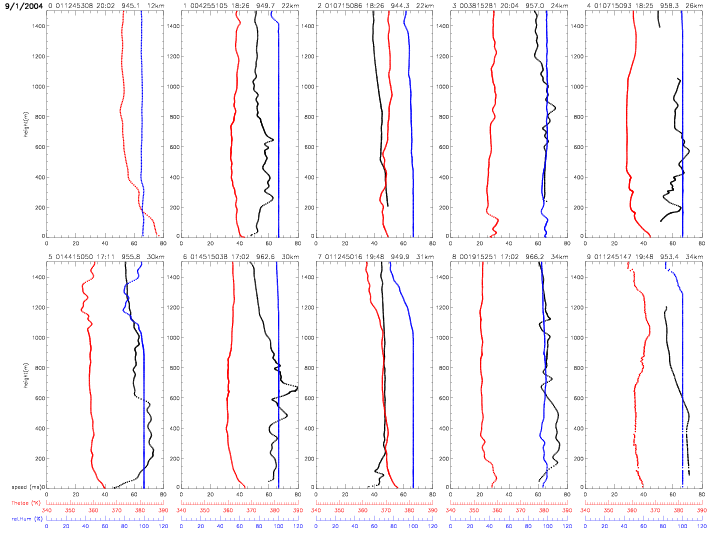
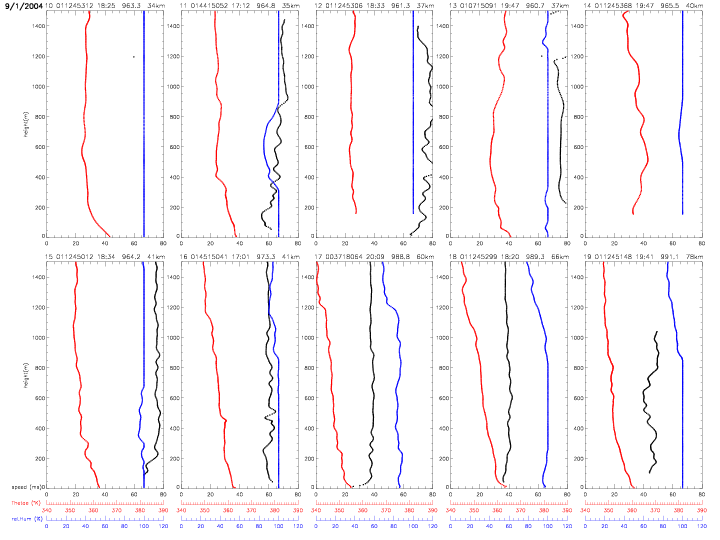
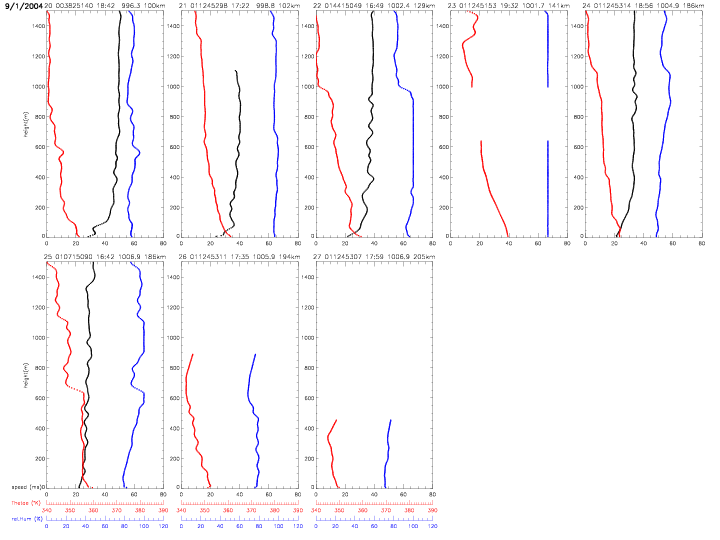
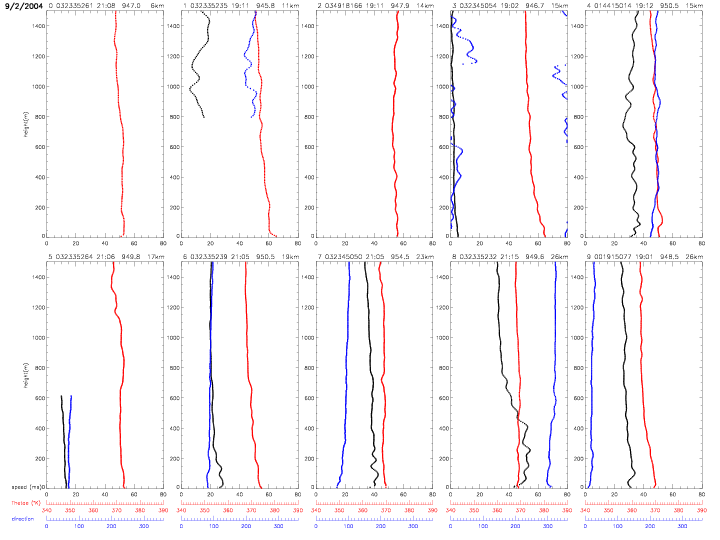
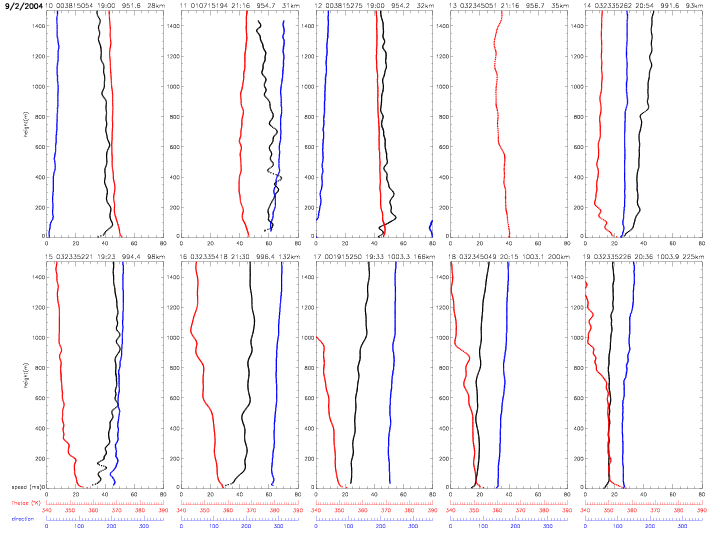
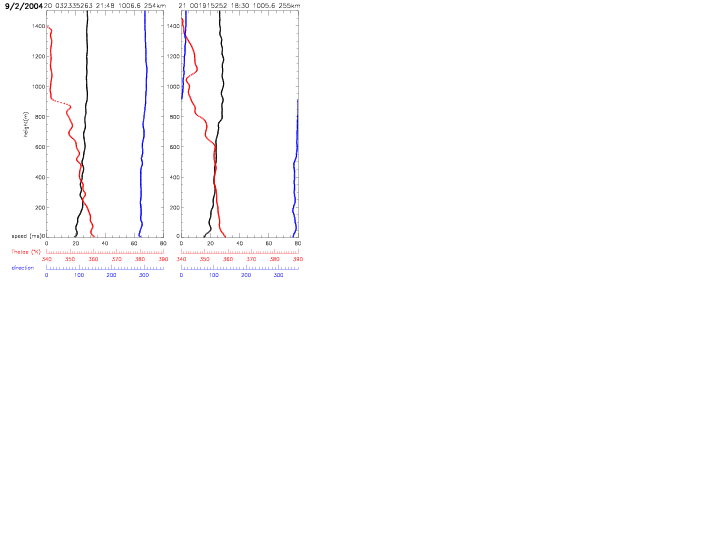
The following profiles show wind direction (in degrees, blue), instead of relative humidity. All other quantities are the same as in above profiles.
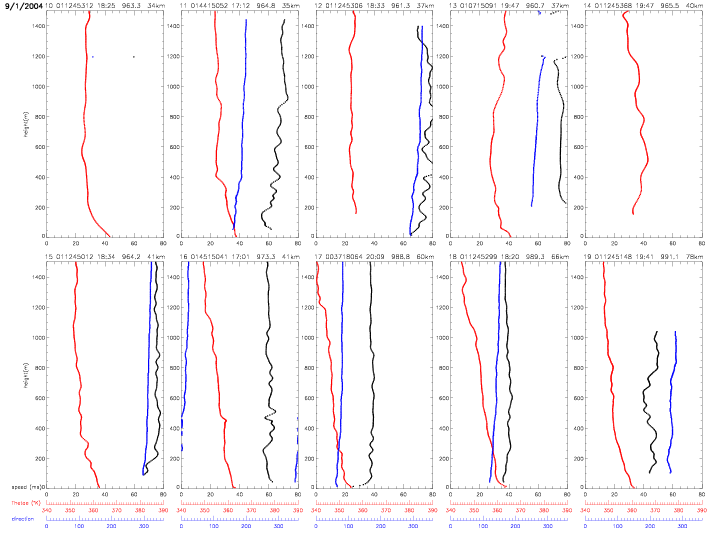
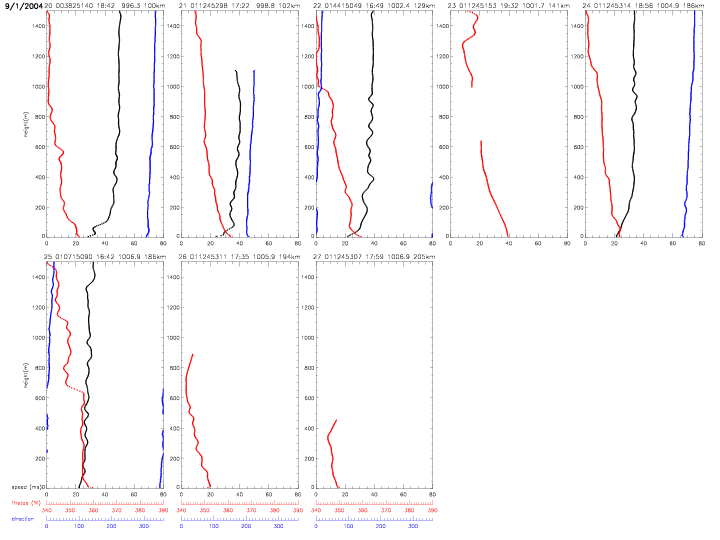


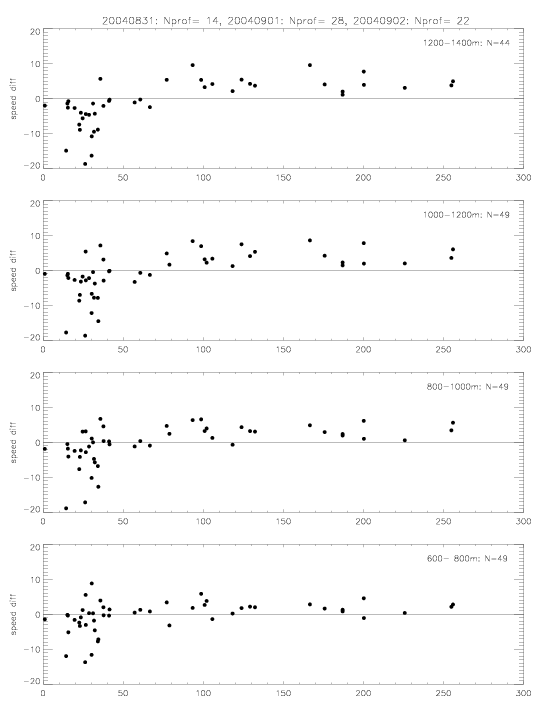
The measured wind speed profiles are investigated further. In the next figure, for each profile 200m vertical wind speed averages are computed and subtracted from the 200-400m profile average. Data from all three flight days are combined (8/31, 9/1, and 9/2/2004). The differences are shown separately for each height interval (600-800m, 800-1000m, 1000-1200m, and 1200-1400m), and as a function of distance from the hurricane center.
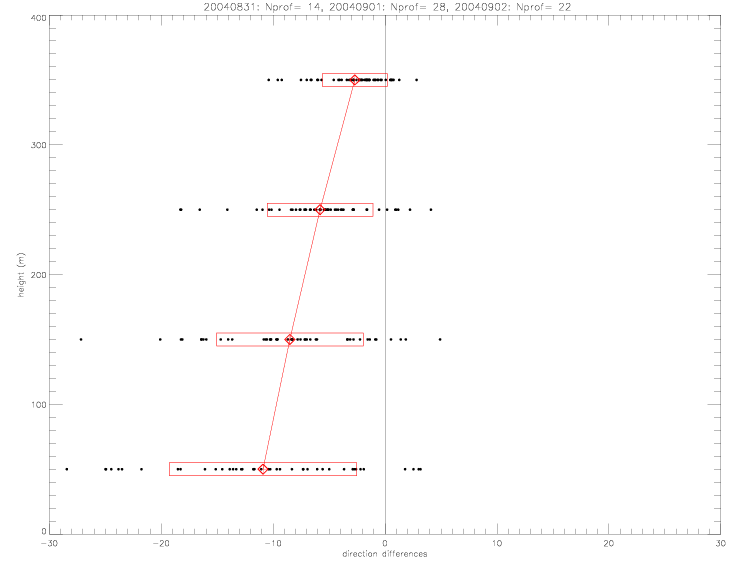
The change in wind direction with height is examined in the next figure. Shown are 100m averages, as differences from the 400-500m average. A negative difference represents a counter-clockwise turn relative to the 400-500m average flow.
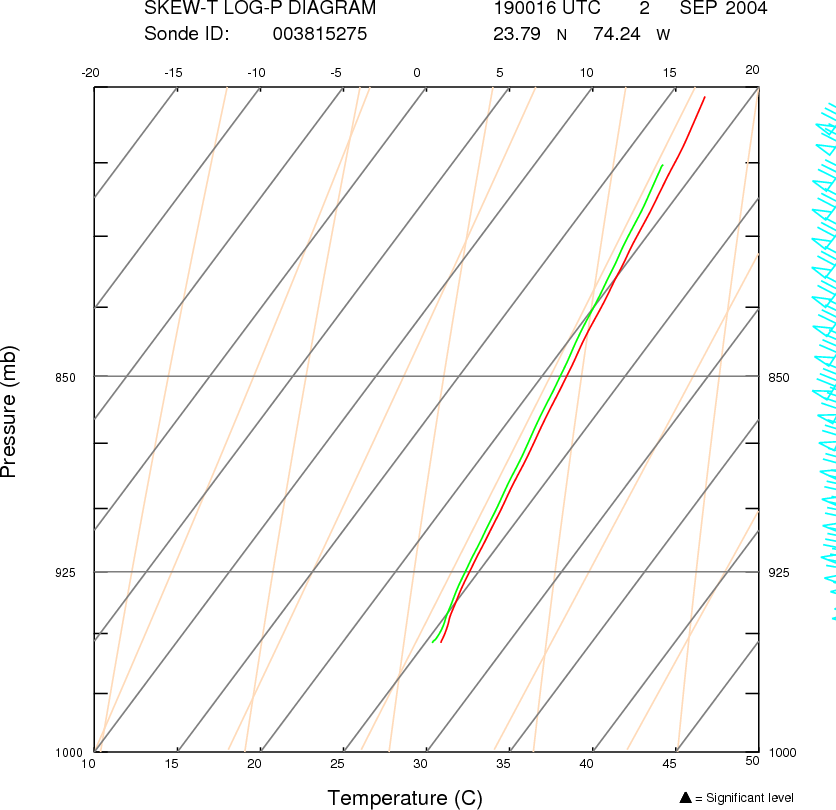
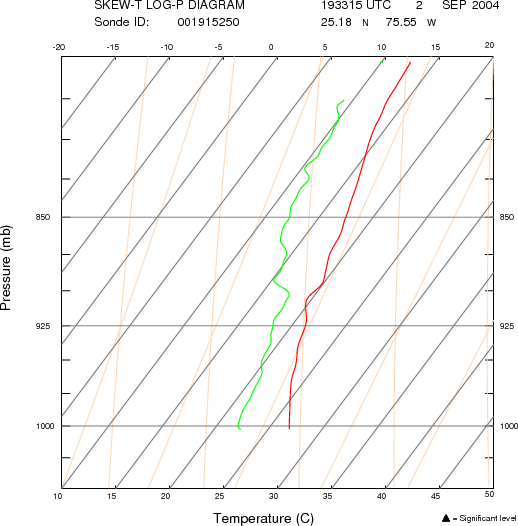
A few selected "skew-T log-P" diagrams are shown below. They were prepared by NOAA's HRD, and can be viewed on their webpage of dropsonde missions for Frances. The pdf images of these two profiles can be seen here (including the wind profile): 19:00UTC , and 19:33UTC .
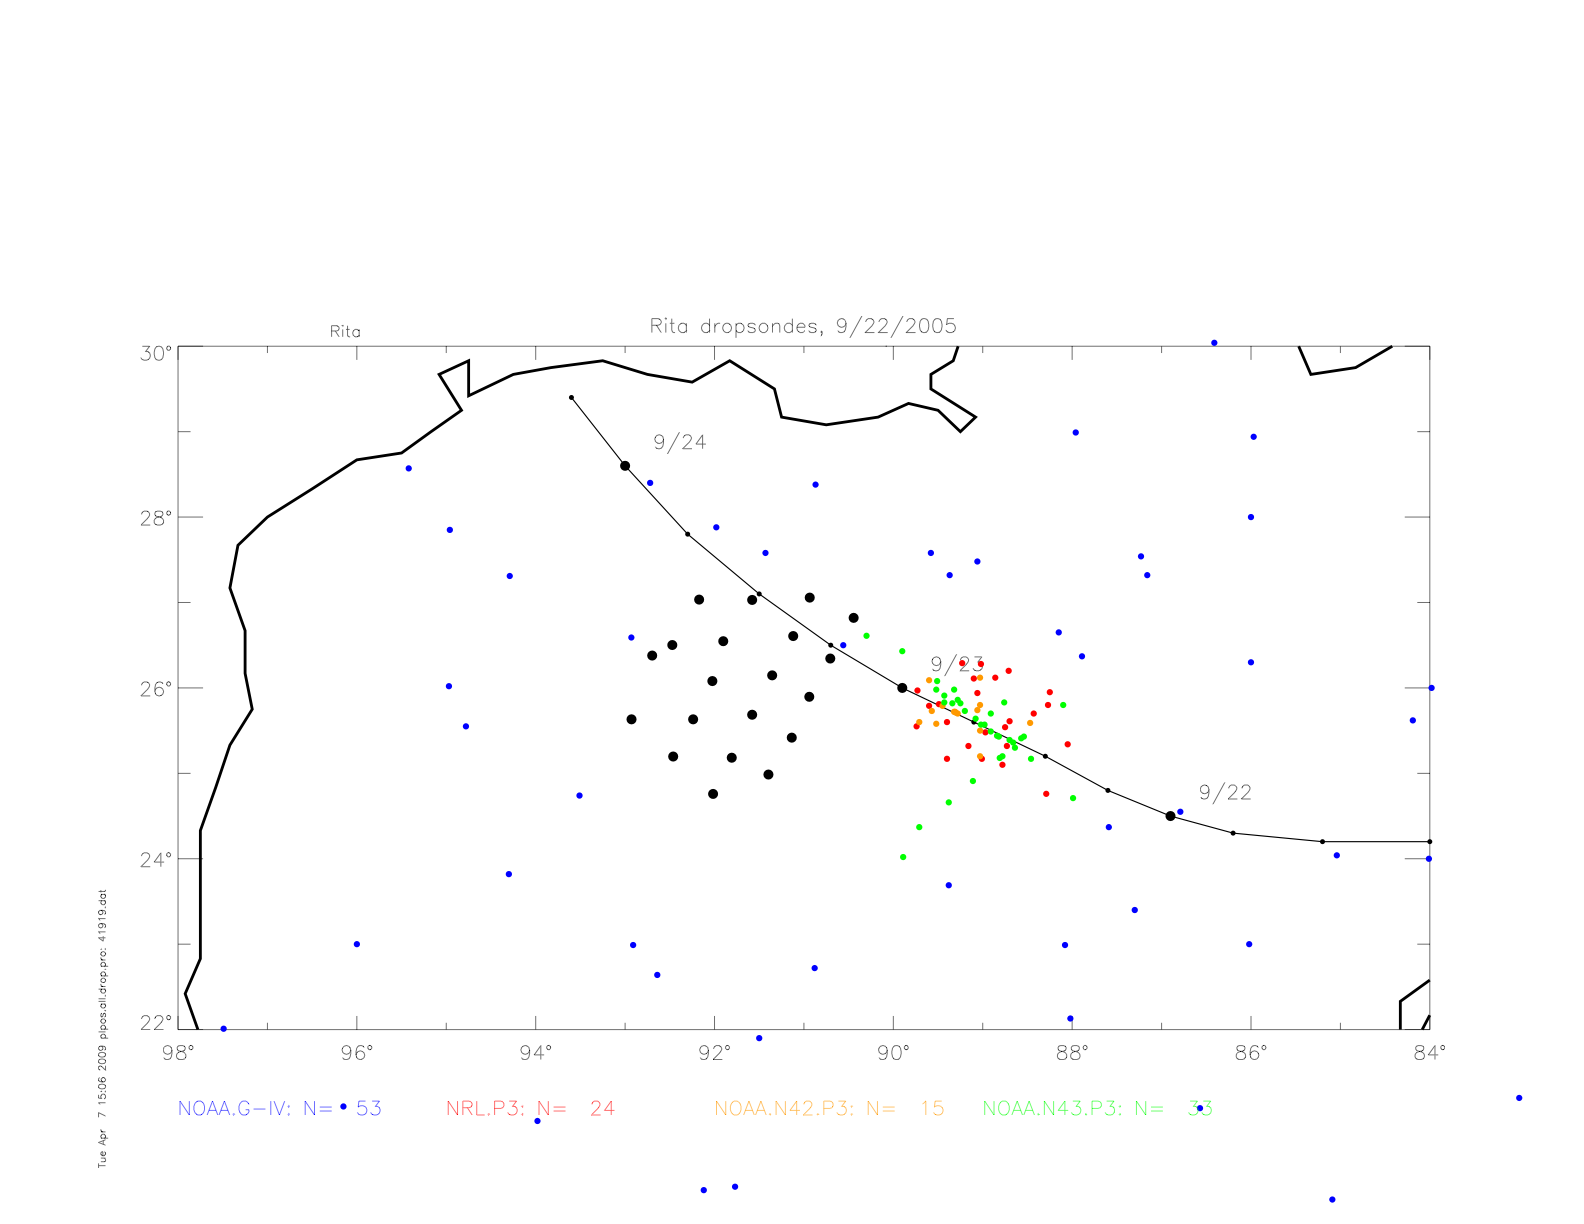
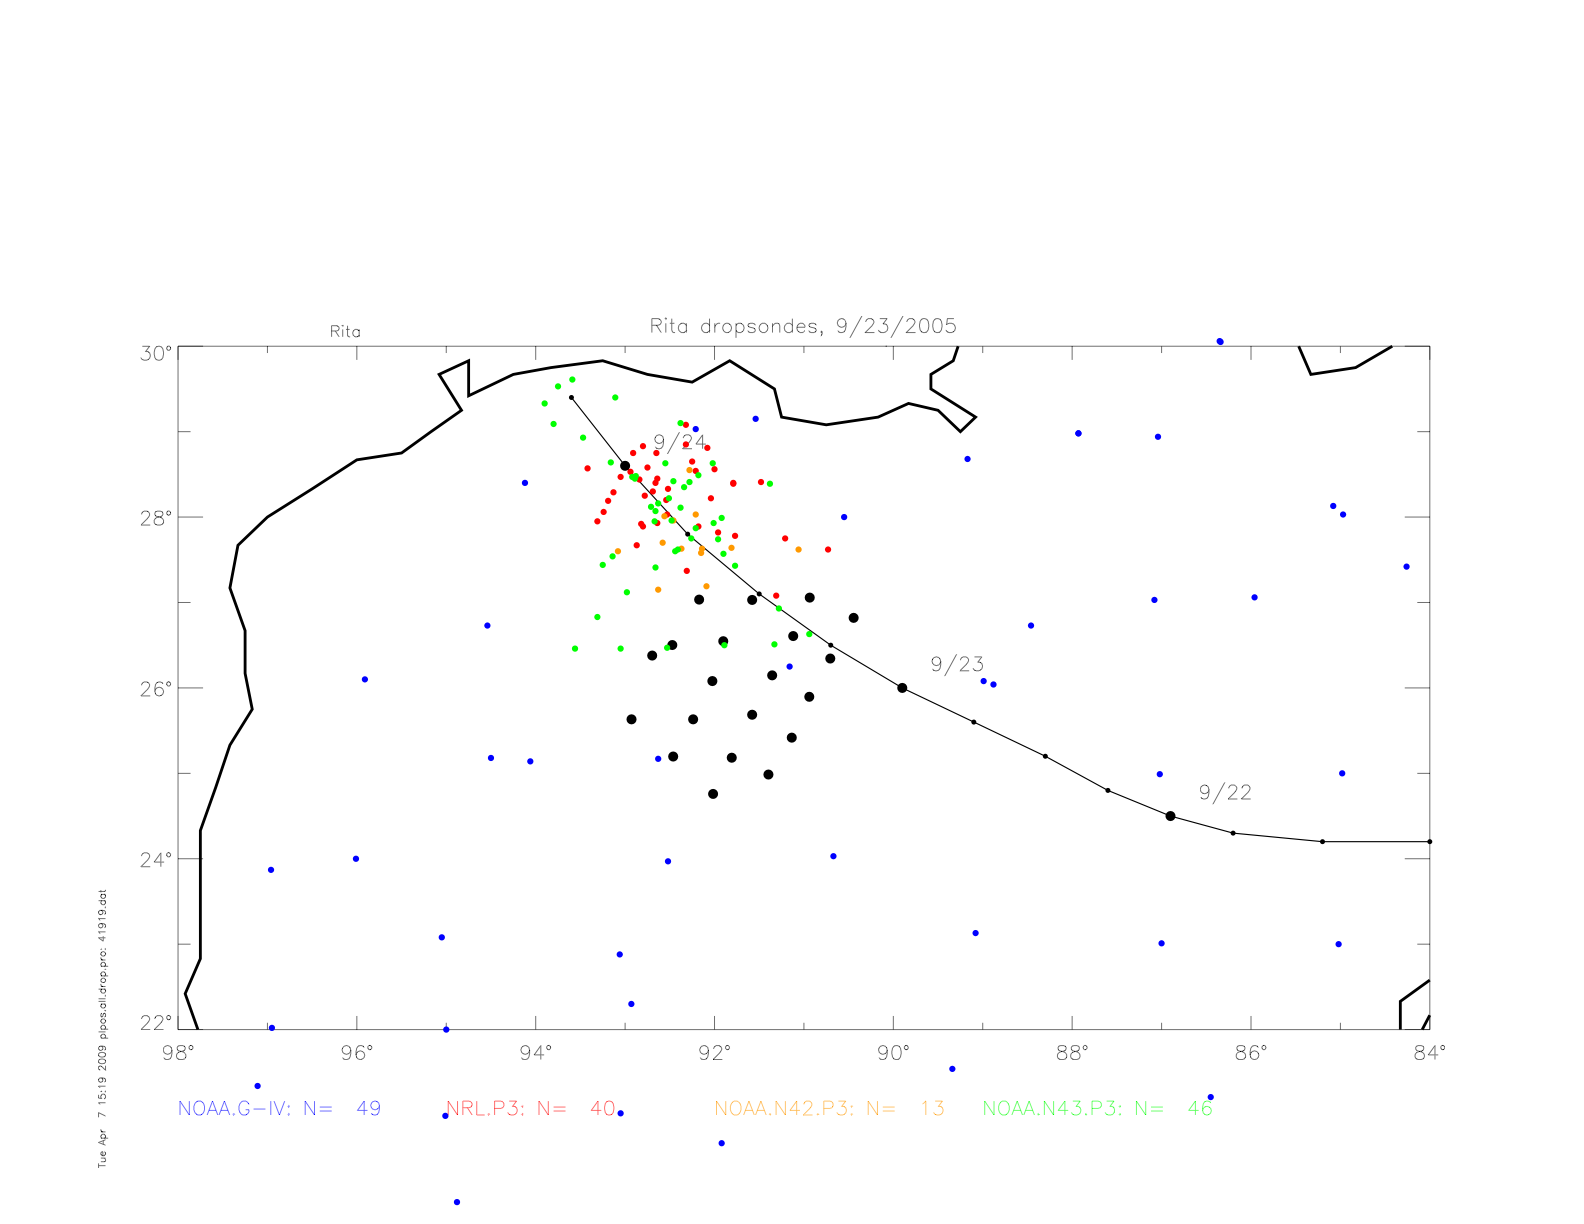
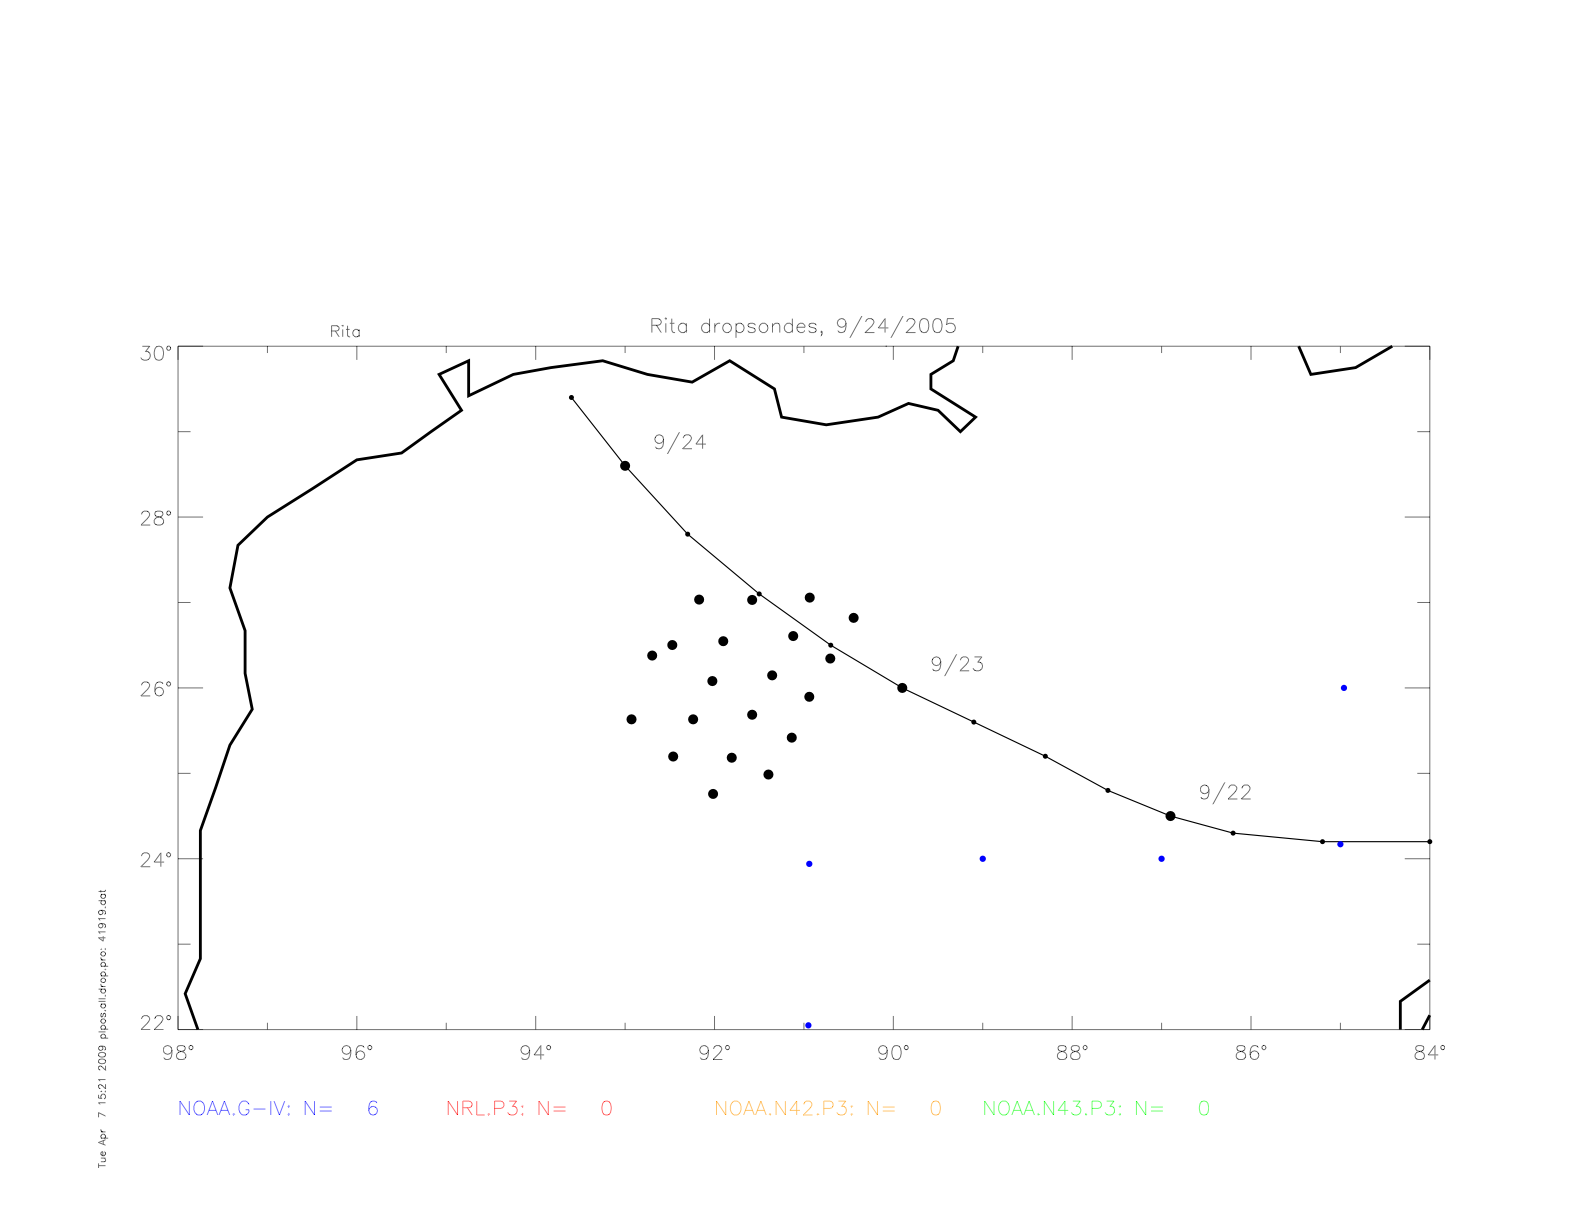
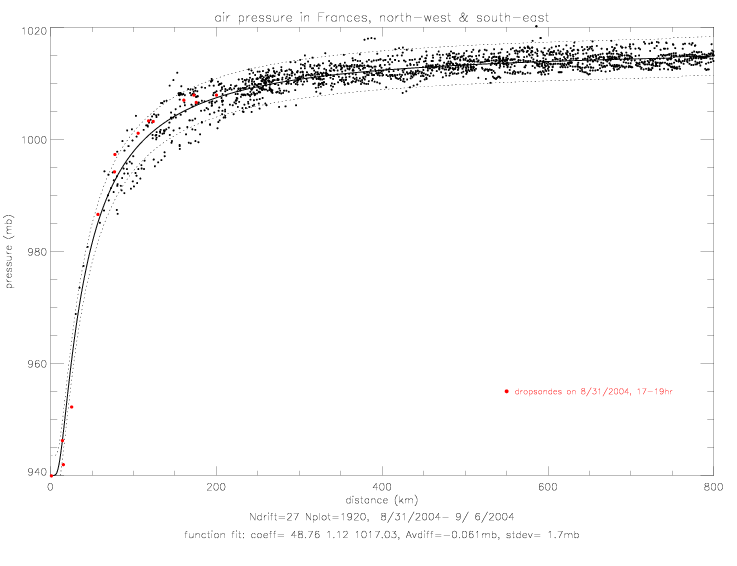
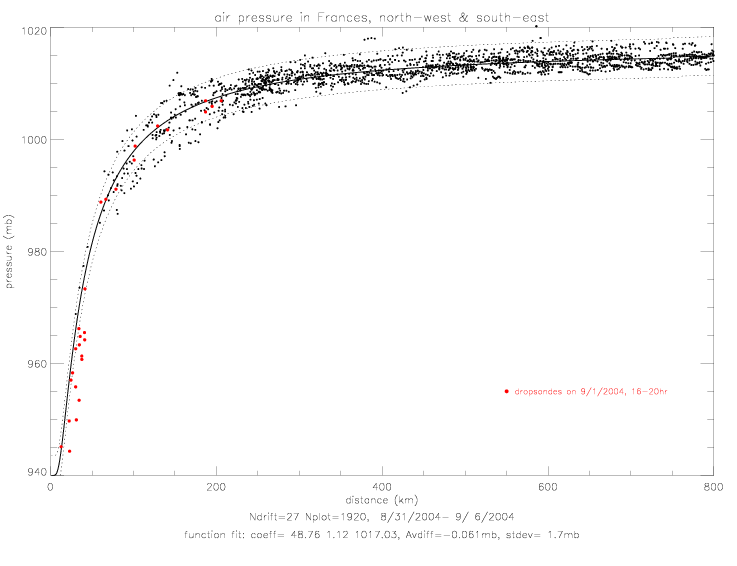
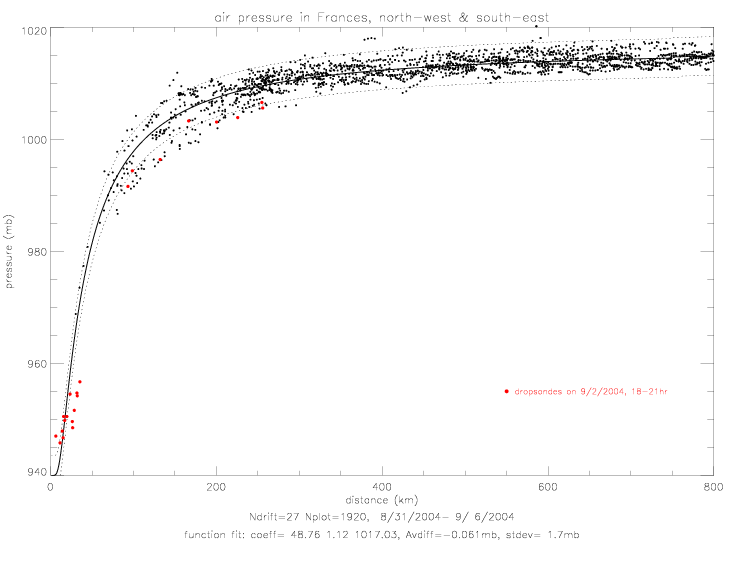
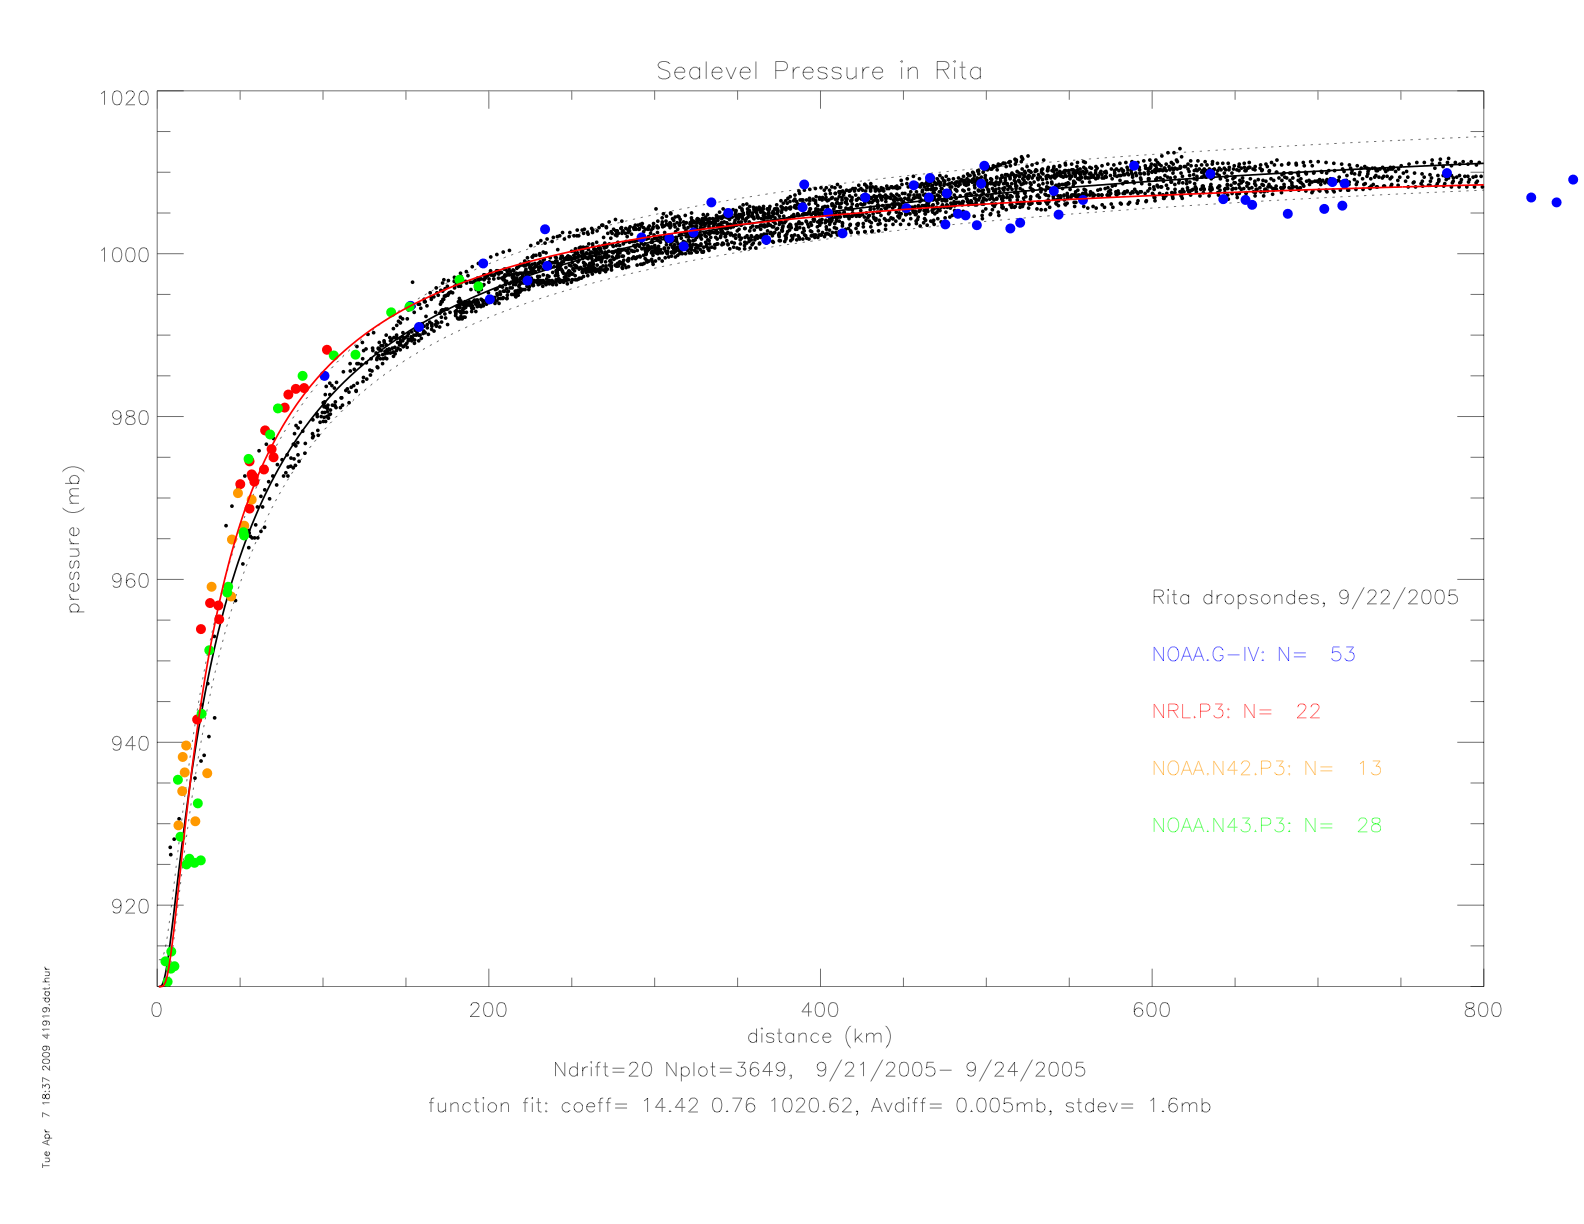
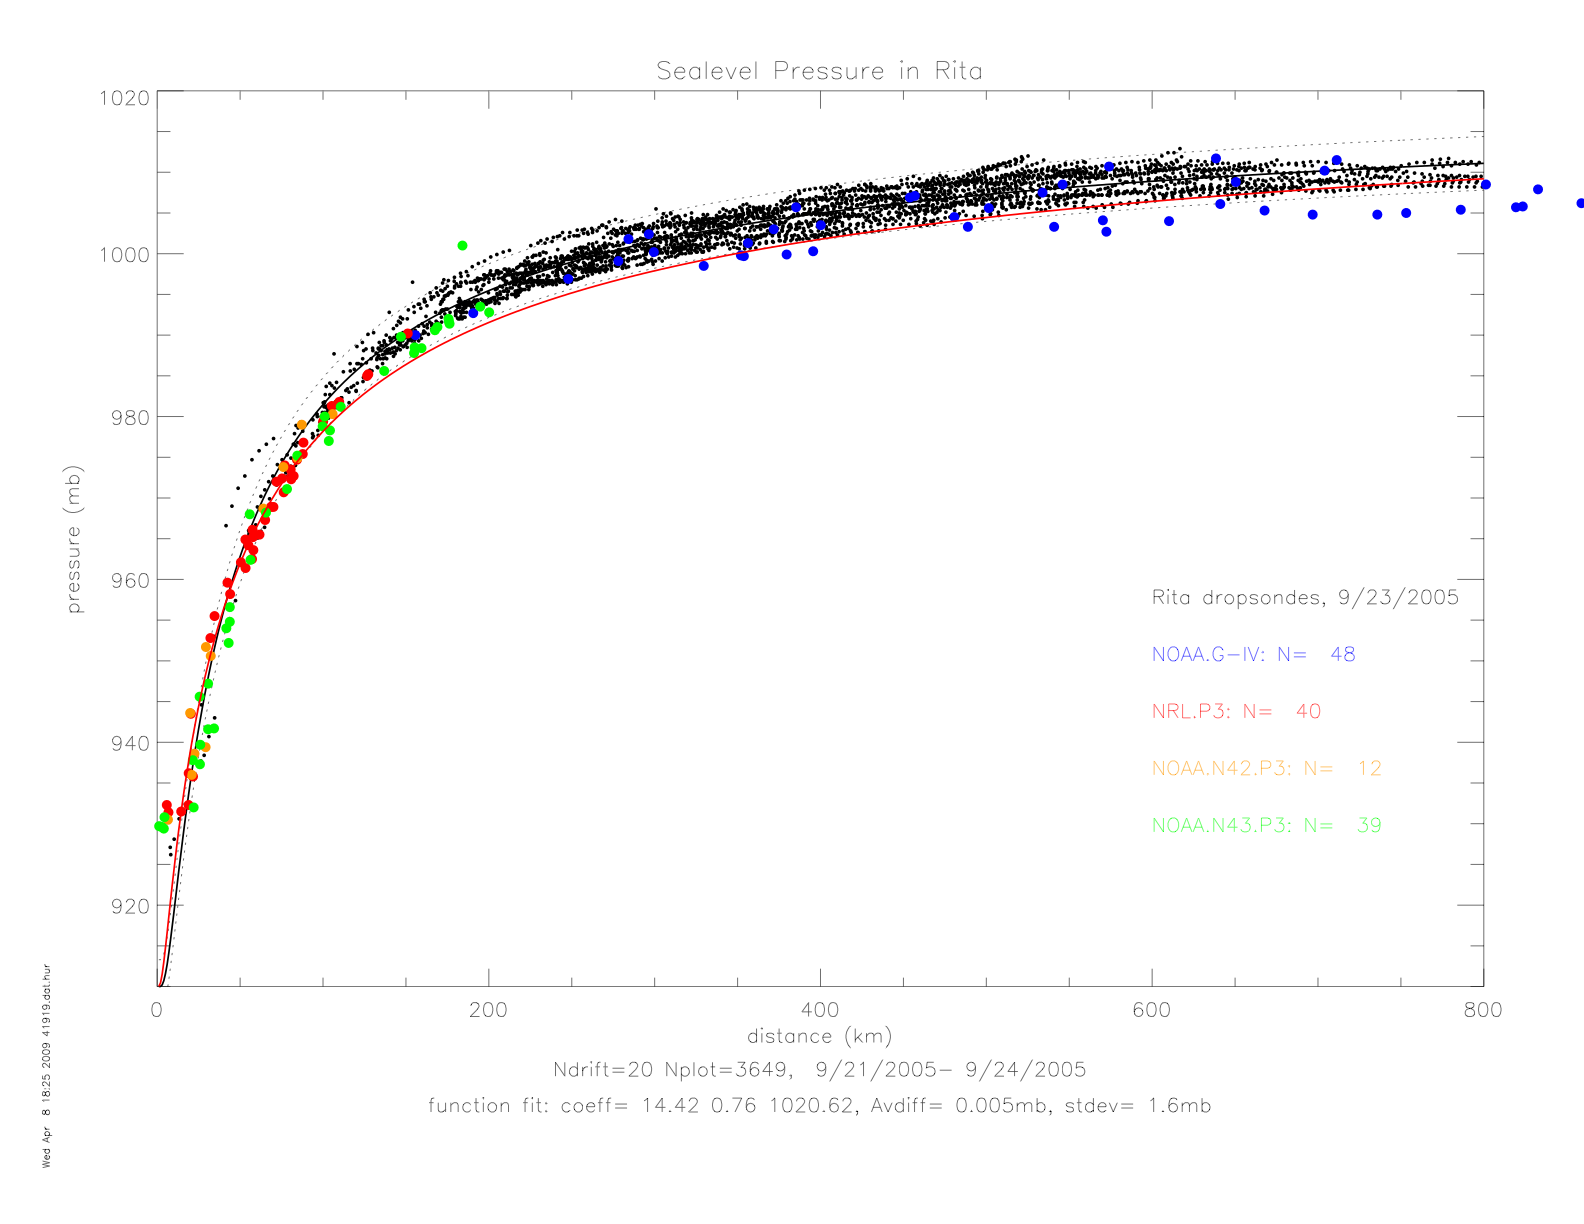
Next are shown the dropwindsonde measured "splash" air pressure dta, together with the drifter observations in Rita. The pressure fit from drifters in shown in black, and the fit to dropwindsondes is shown in red. Note, that from September 22 to 24 the hurricane decreased in strength, from Category 5 on 9/22 at 3:00 UTC to Category 3 on 9/23 at 18:00 UTC.
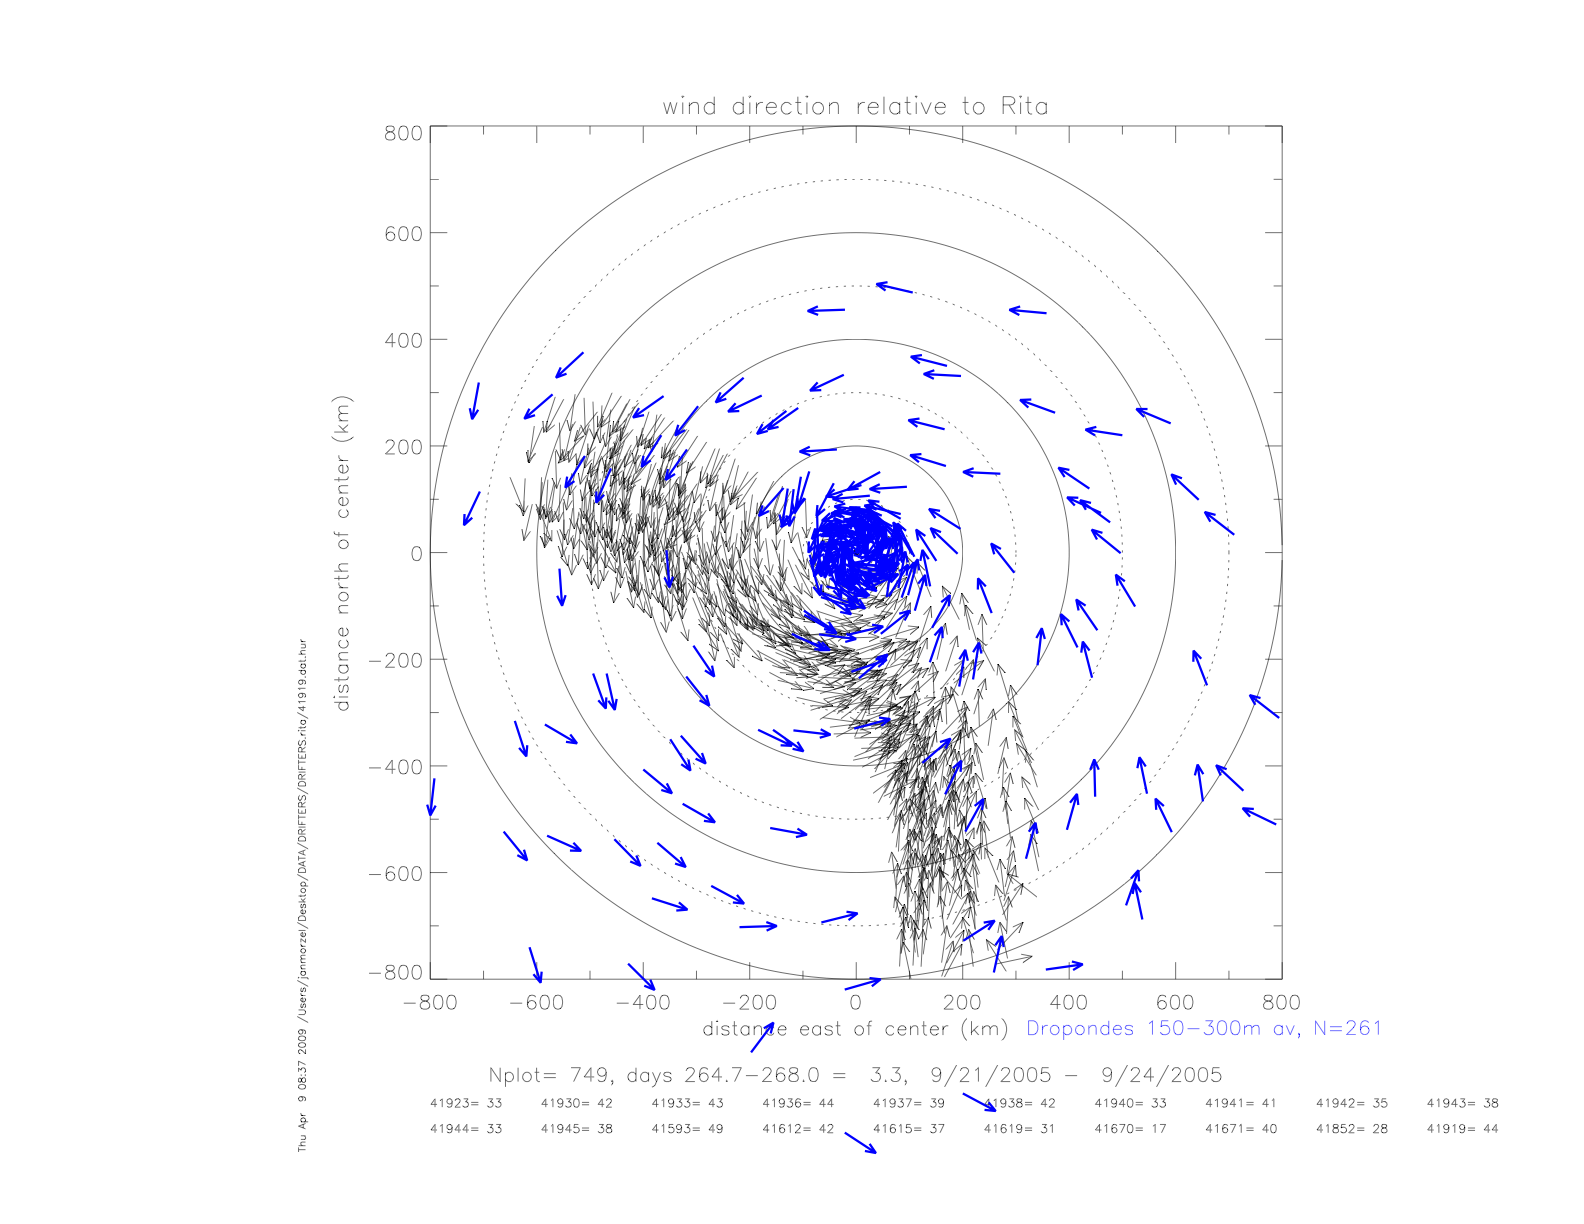
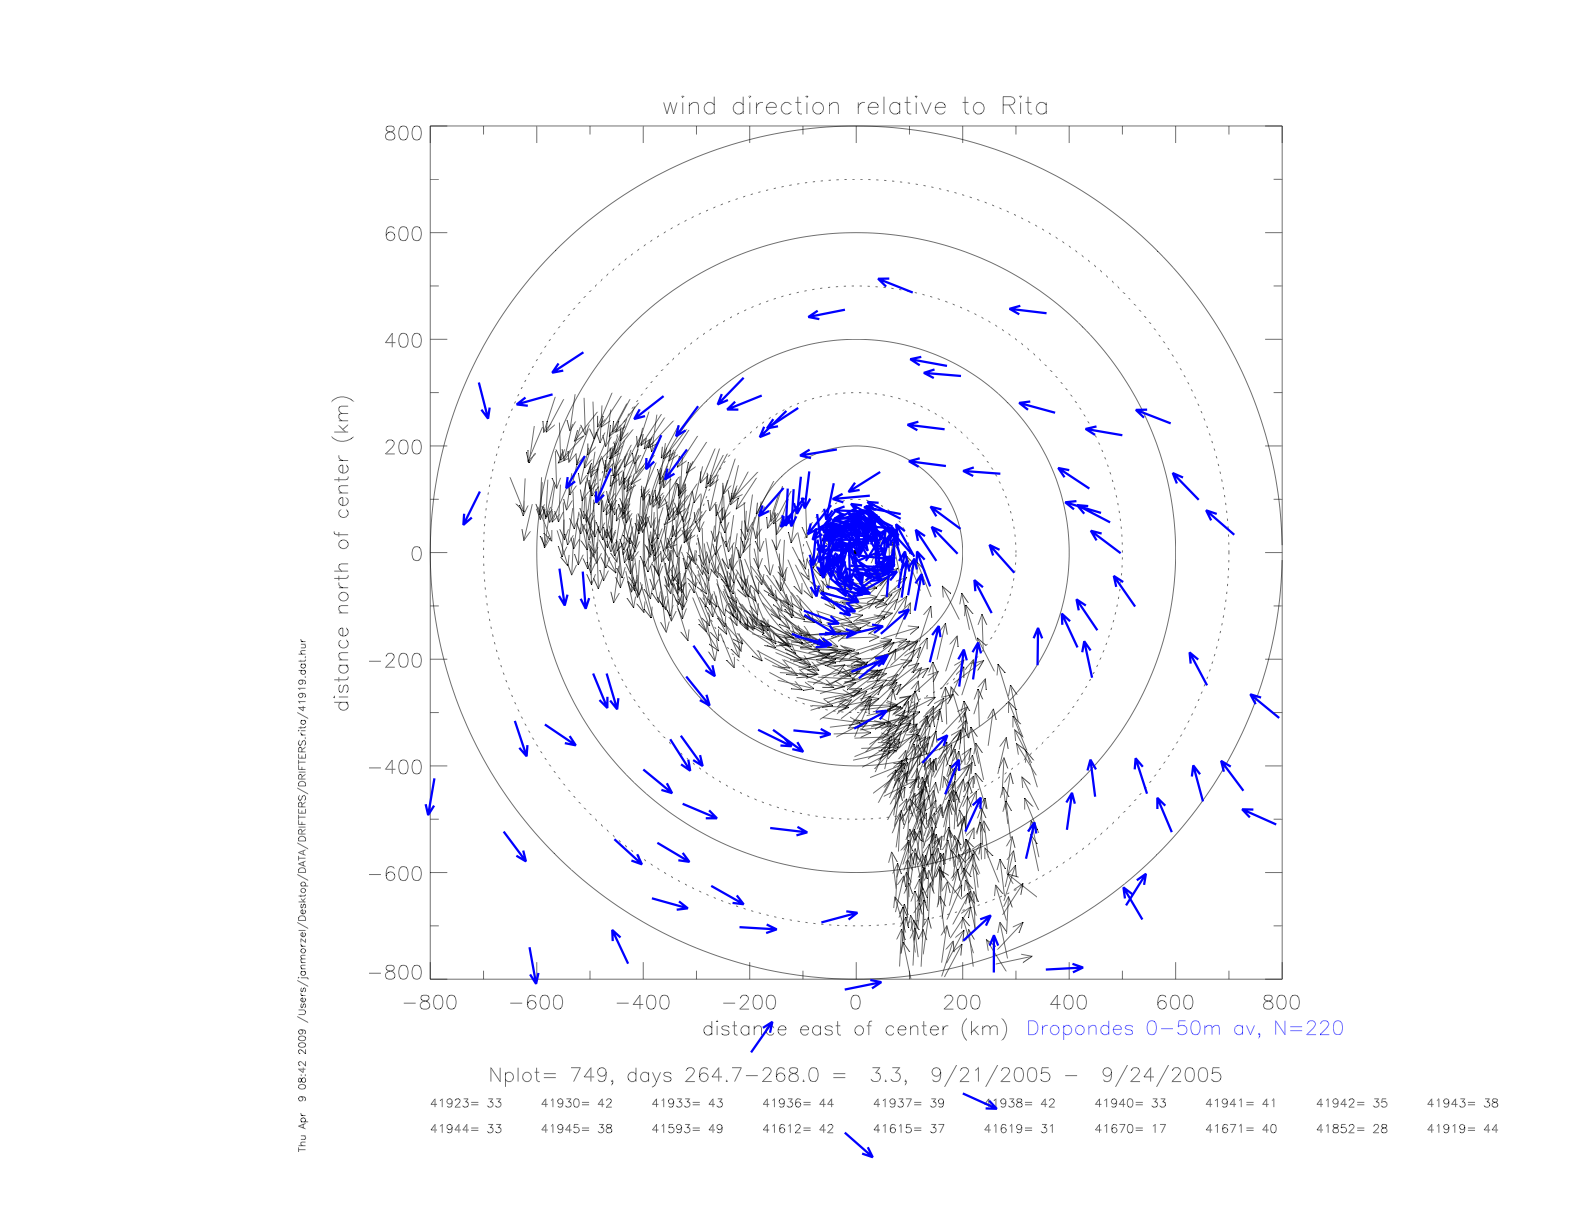
The storm relative wind directions are wshown in the next figure. Dropwindsonde data are shown as vertical averages from 150-300m, and 0-50m.
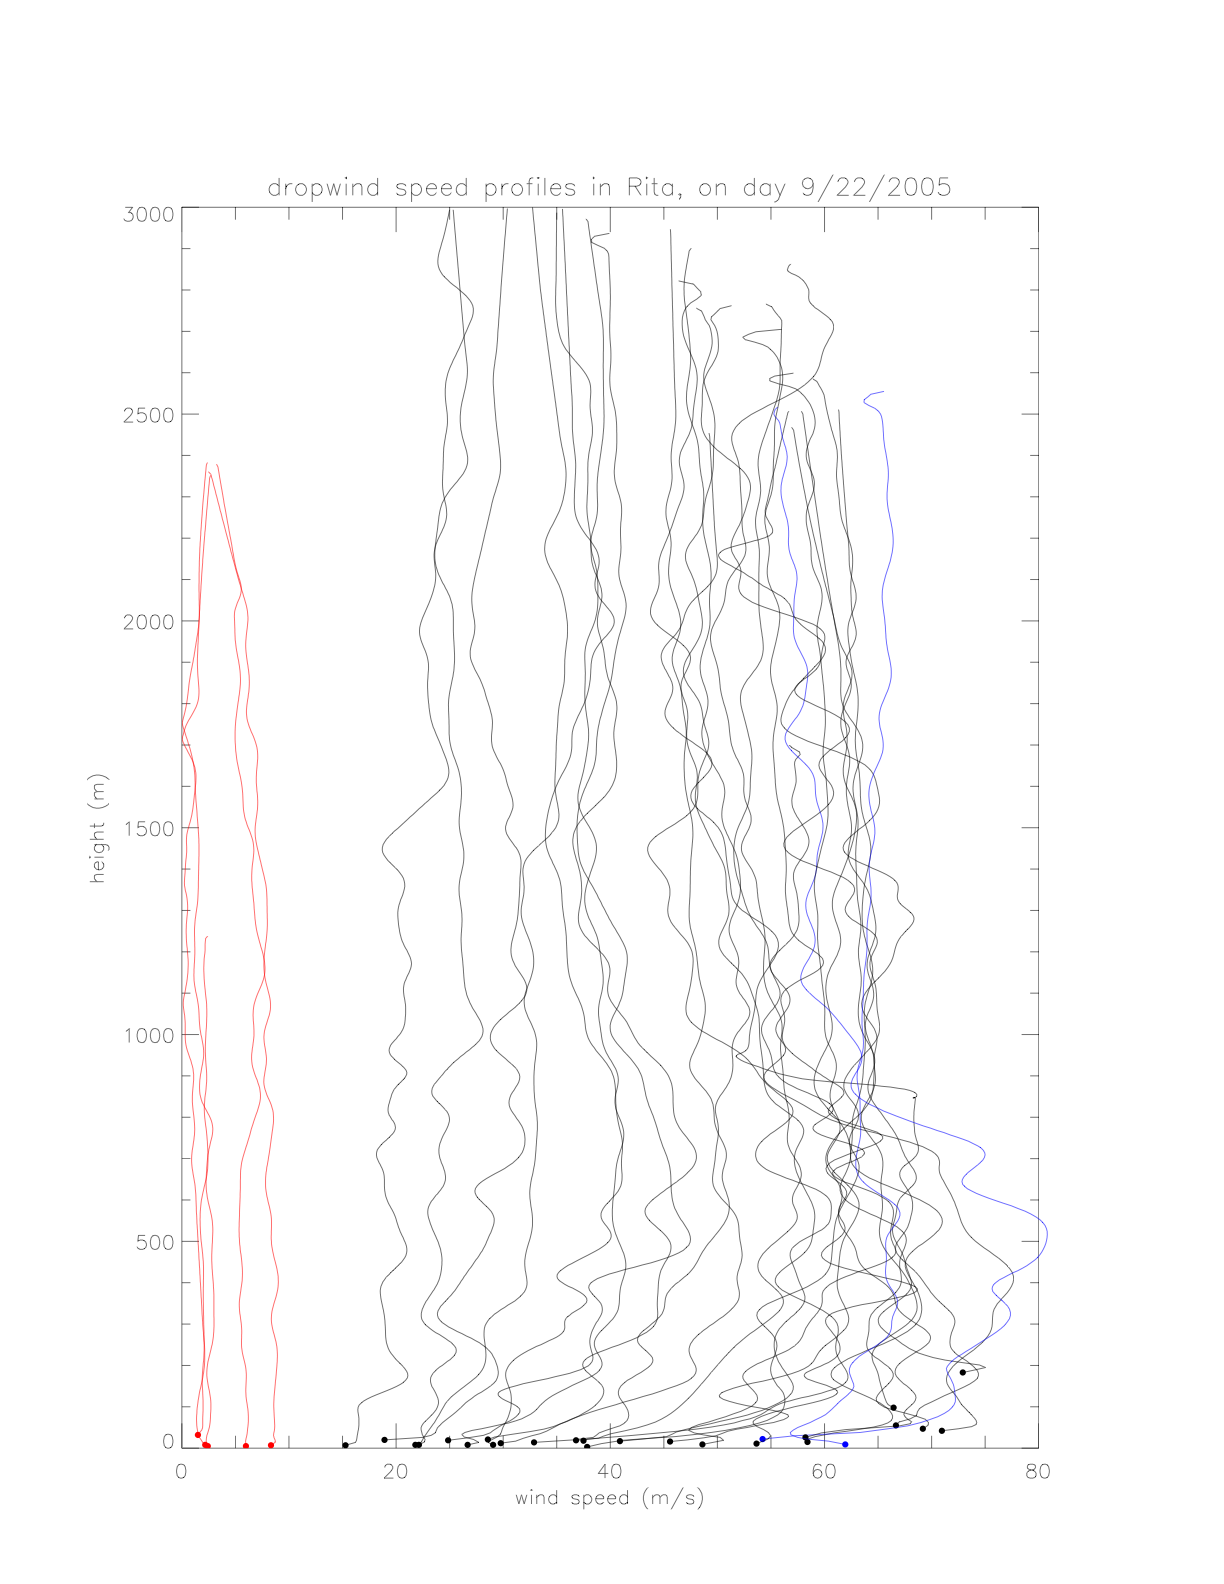
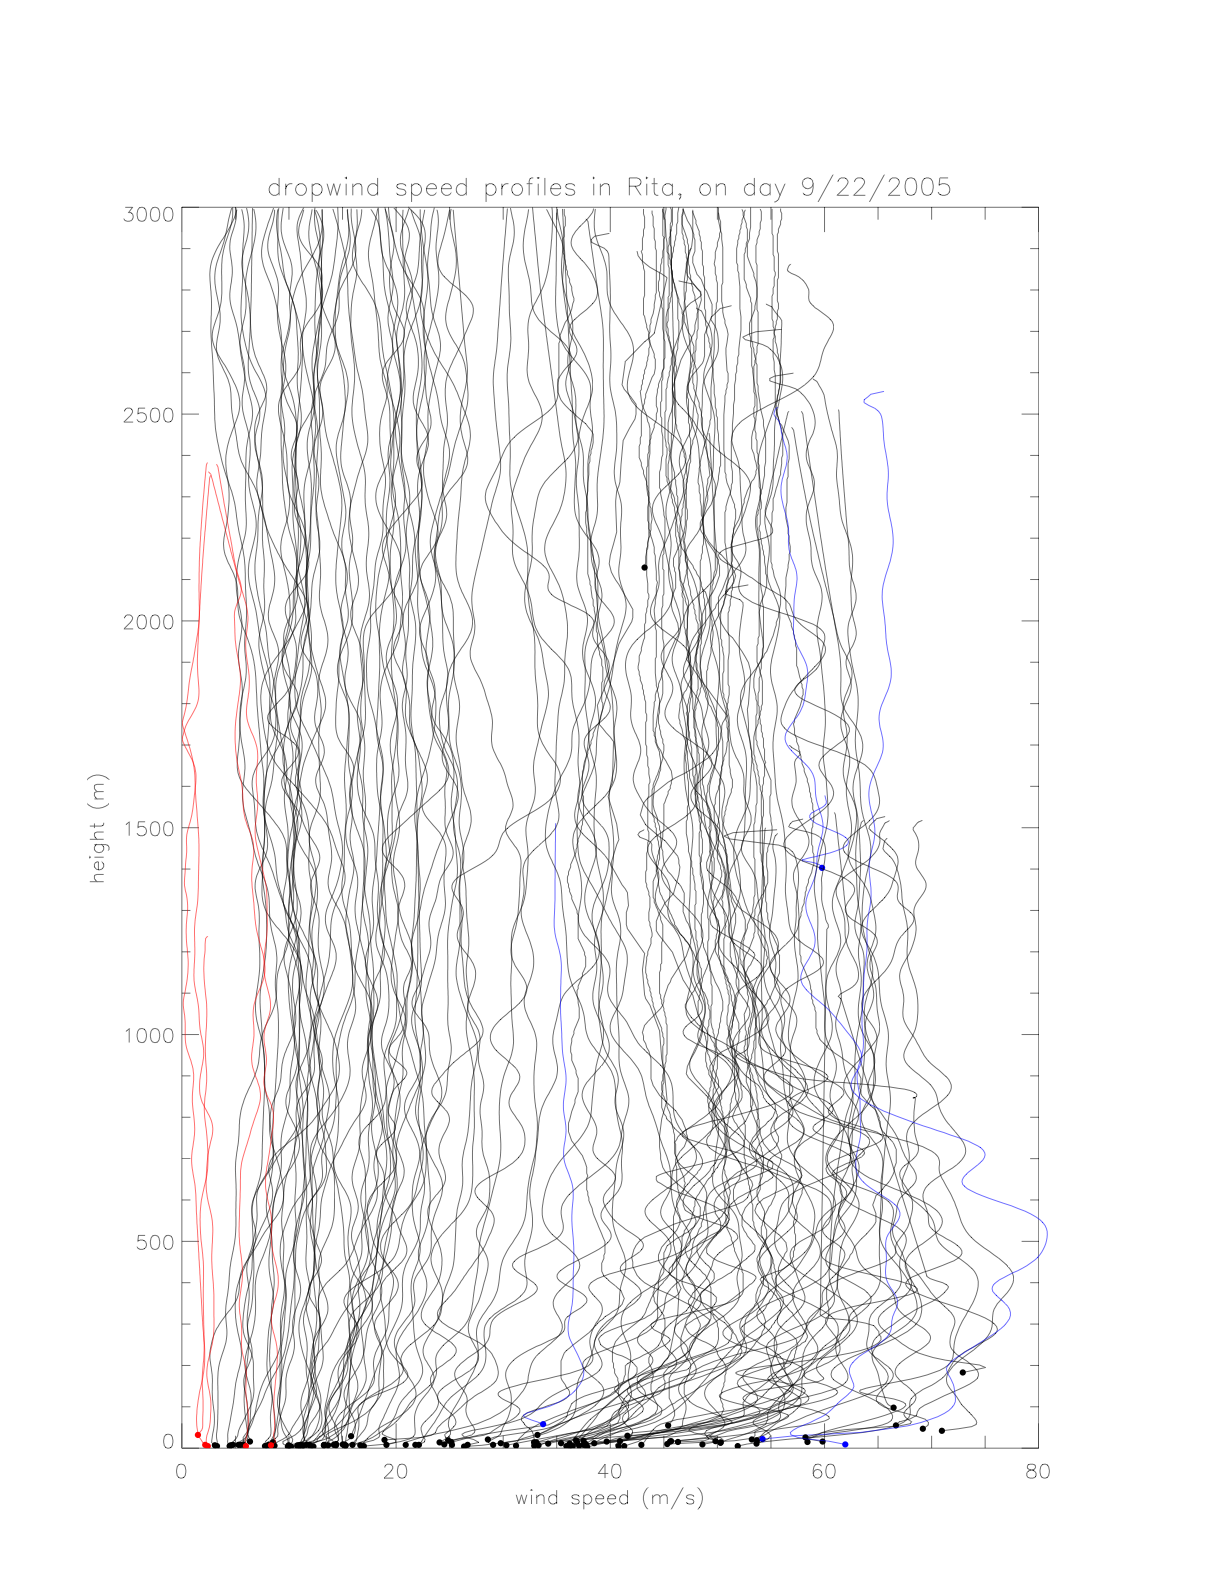
Vertical profiles of the dropwindsonde data are presented below.
As there is relatively high vertical variability in individual pressure profiles, the data are averaged according to distance from the hurricane center. In order to combine similar profiles, and maintain a reasonable bin number, the following distance intervals are chosen: (15-50km: Nprofile=23), (50-100km: Nprofile=22), and (100-300km: Nprofile=16). Individual profiles and resulting avreages are shown in the next figures.
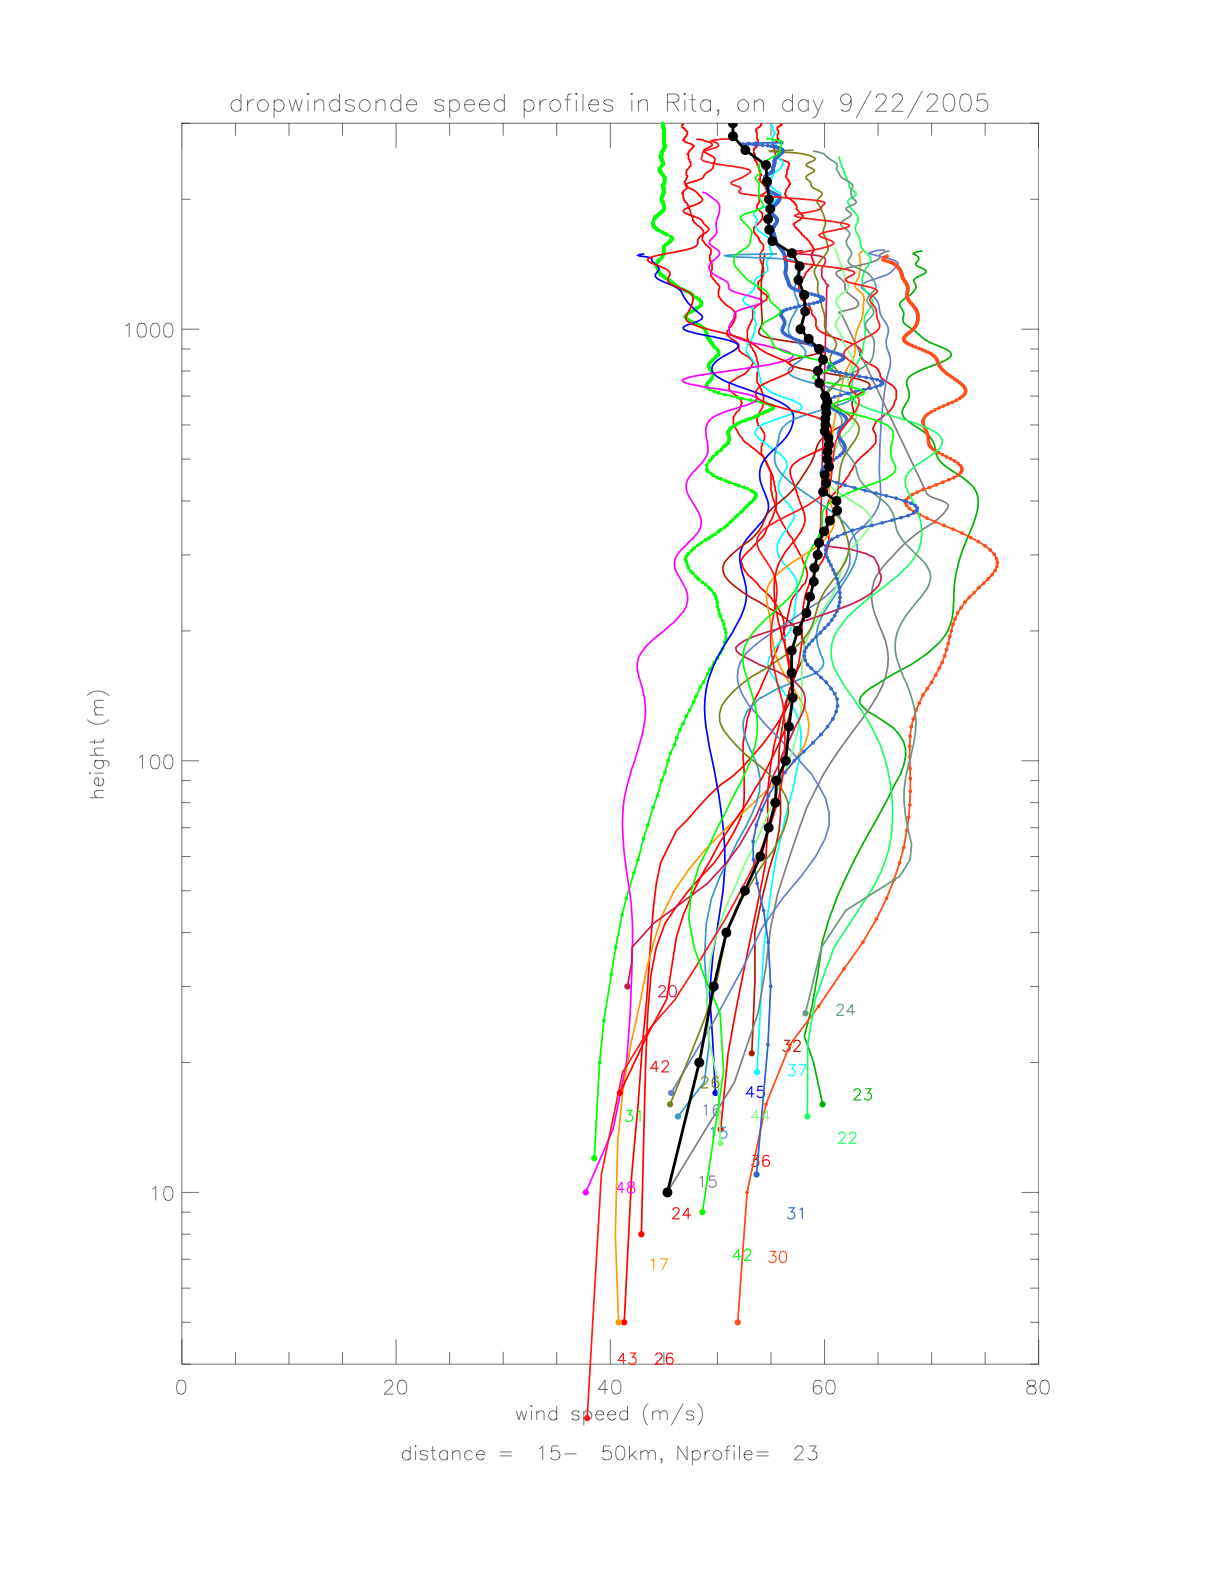
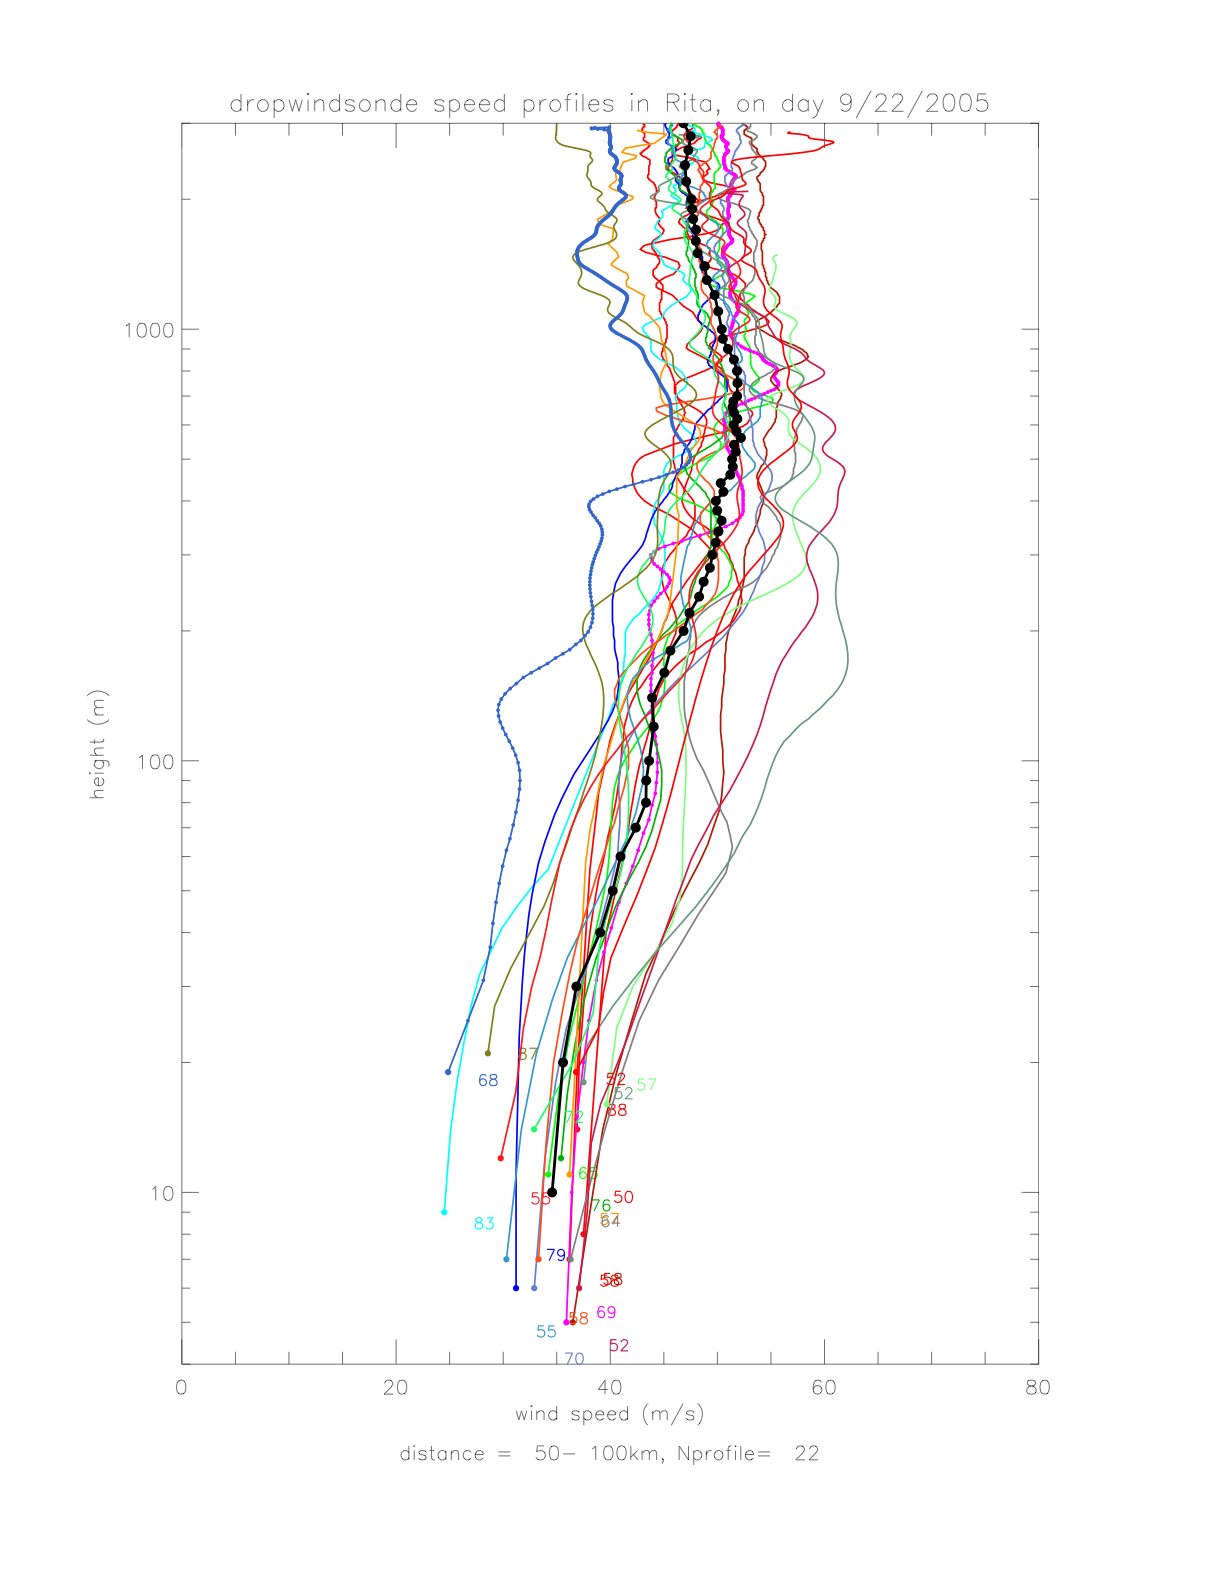
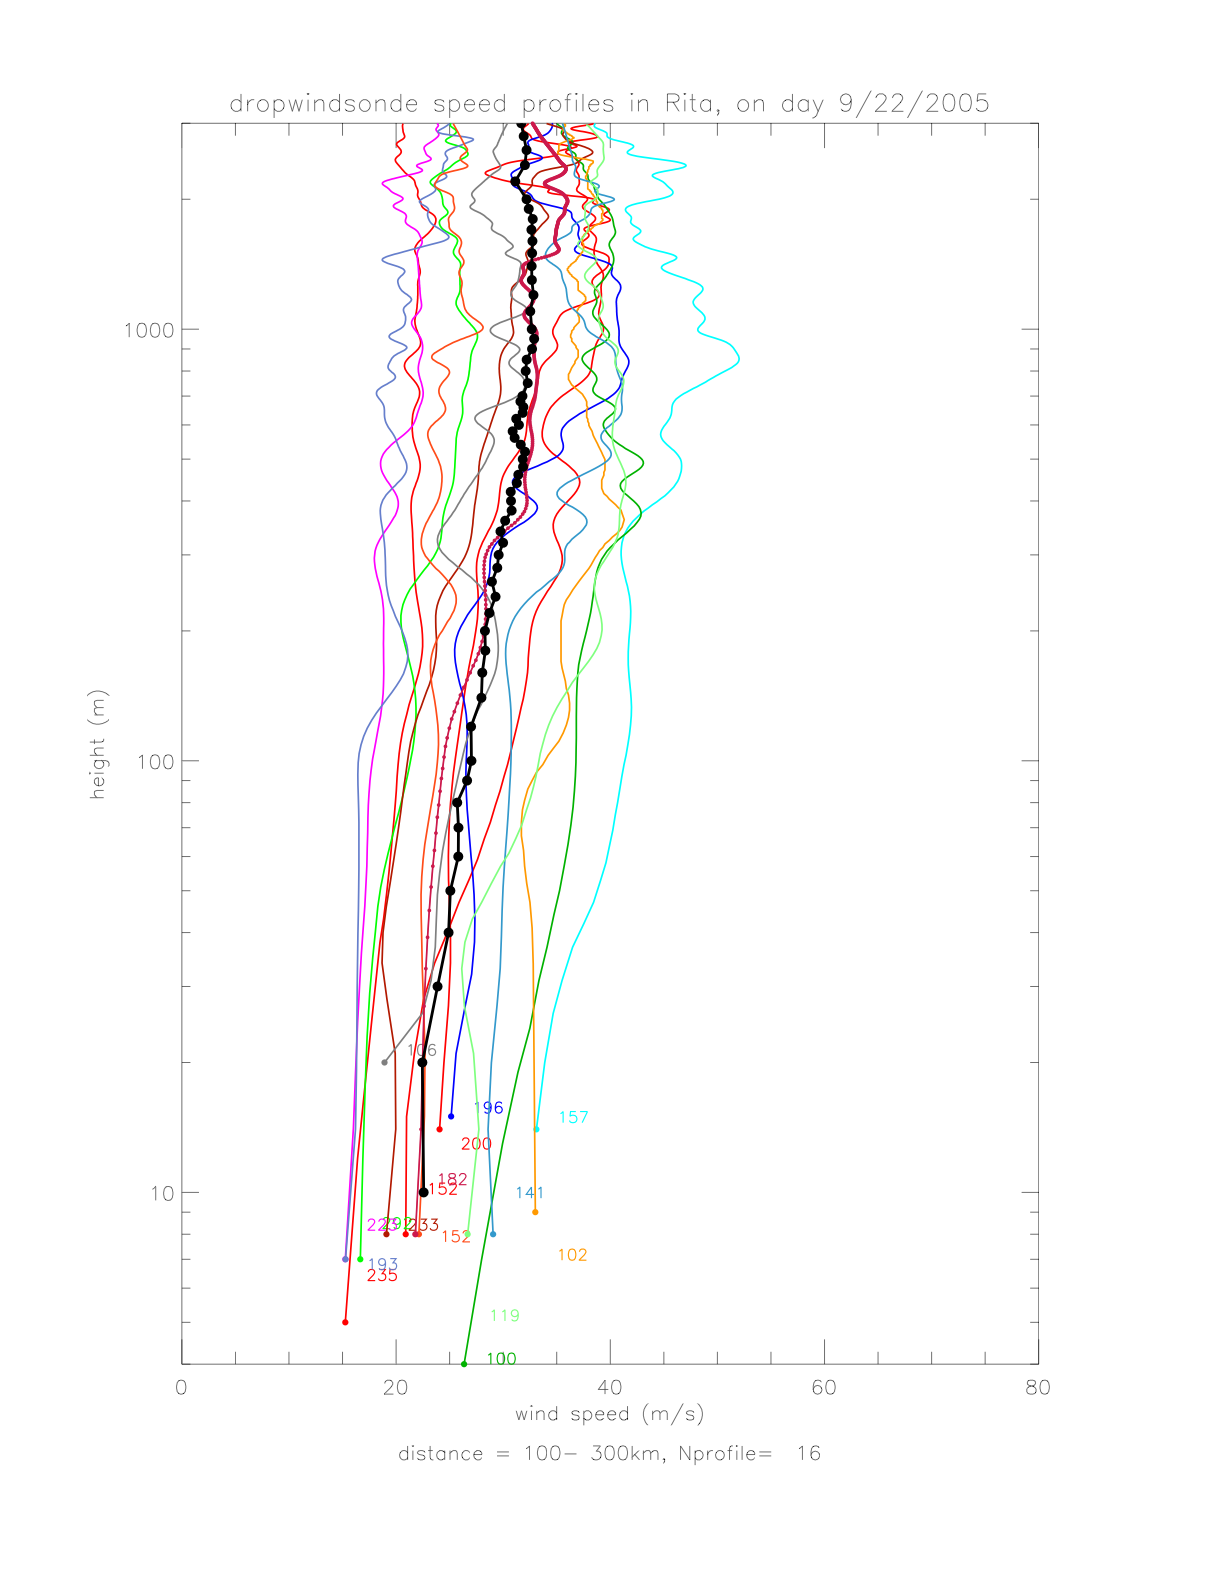
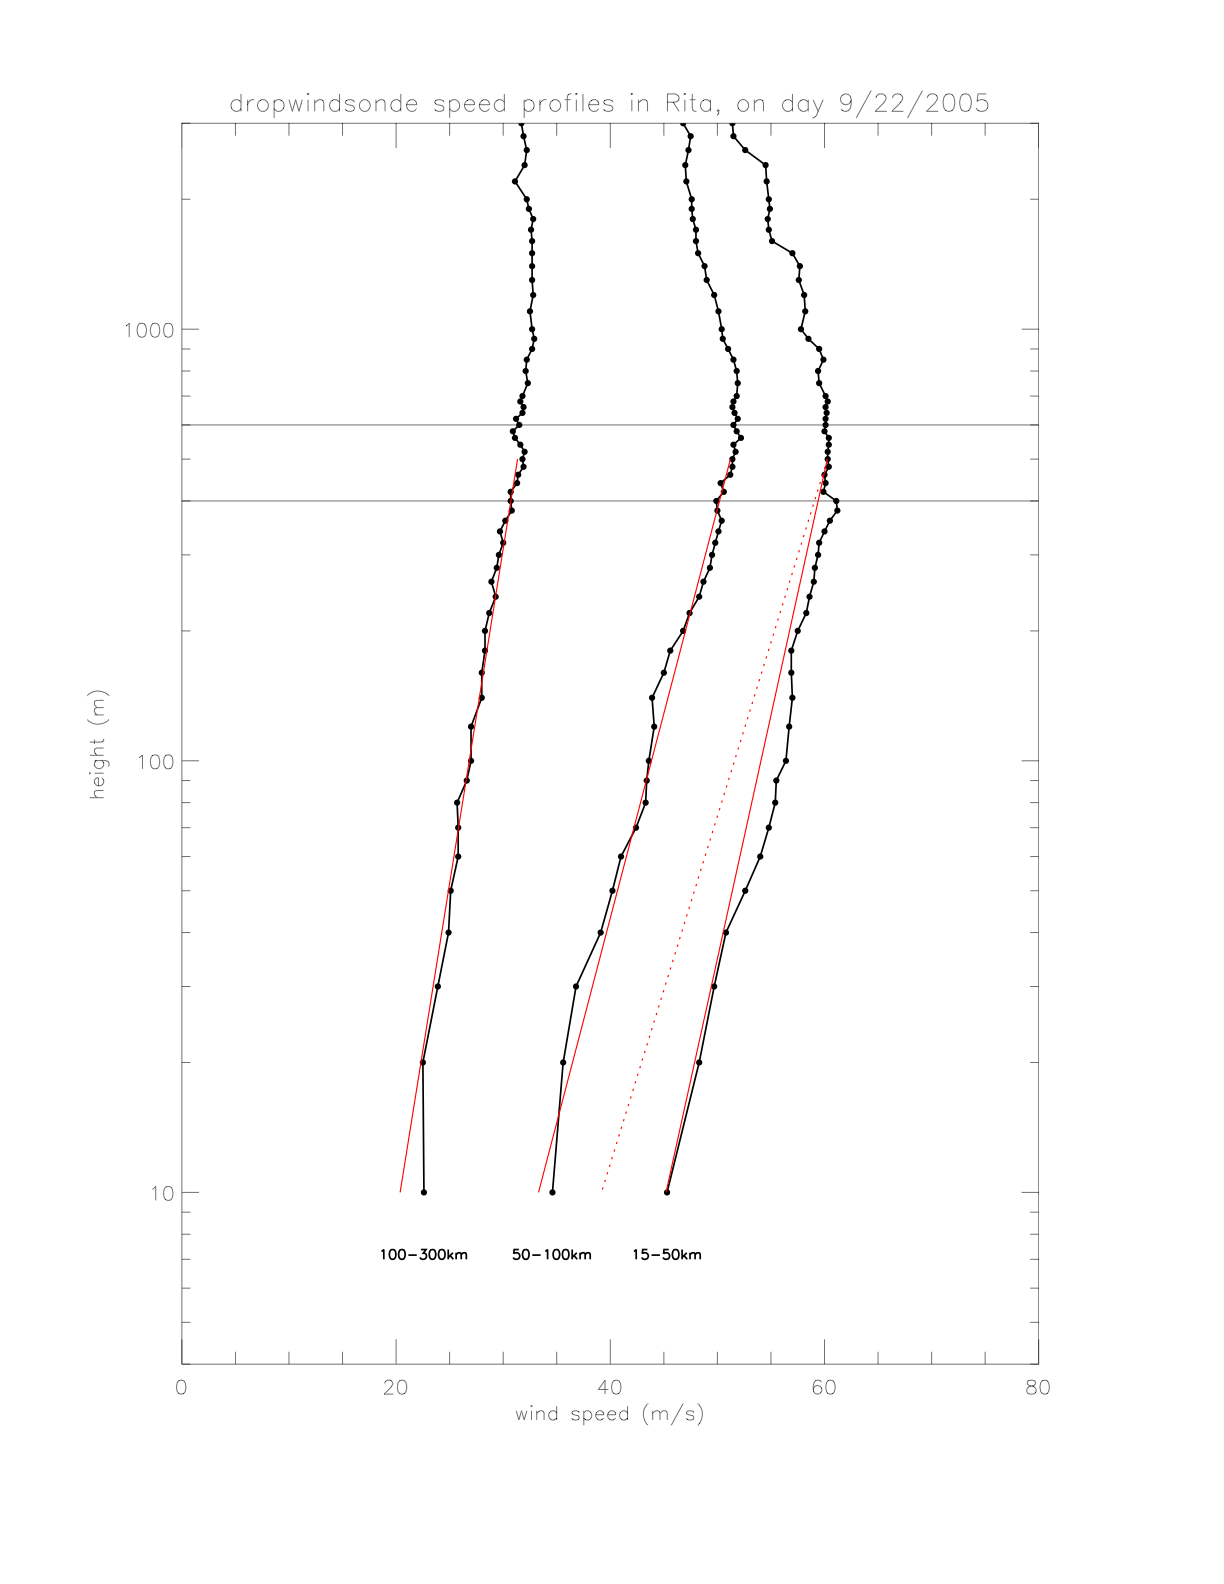
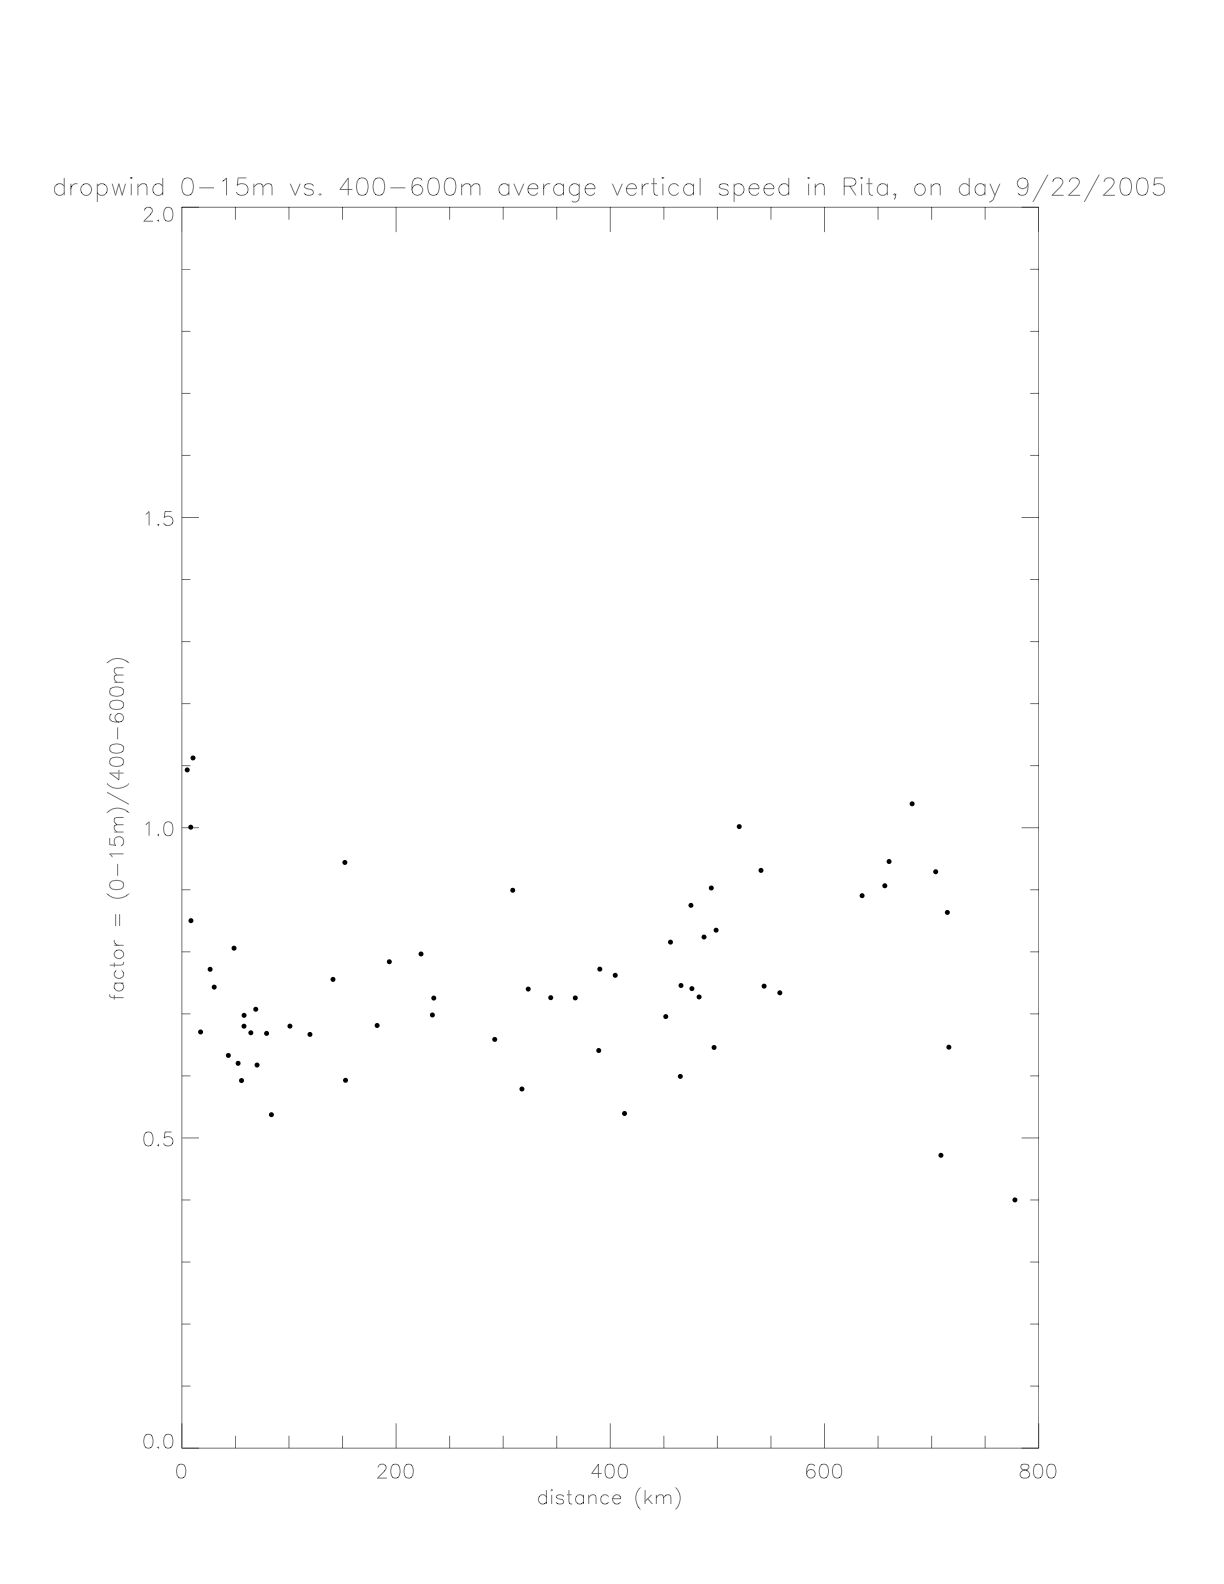
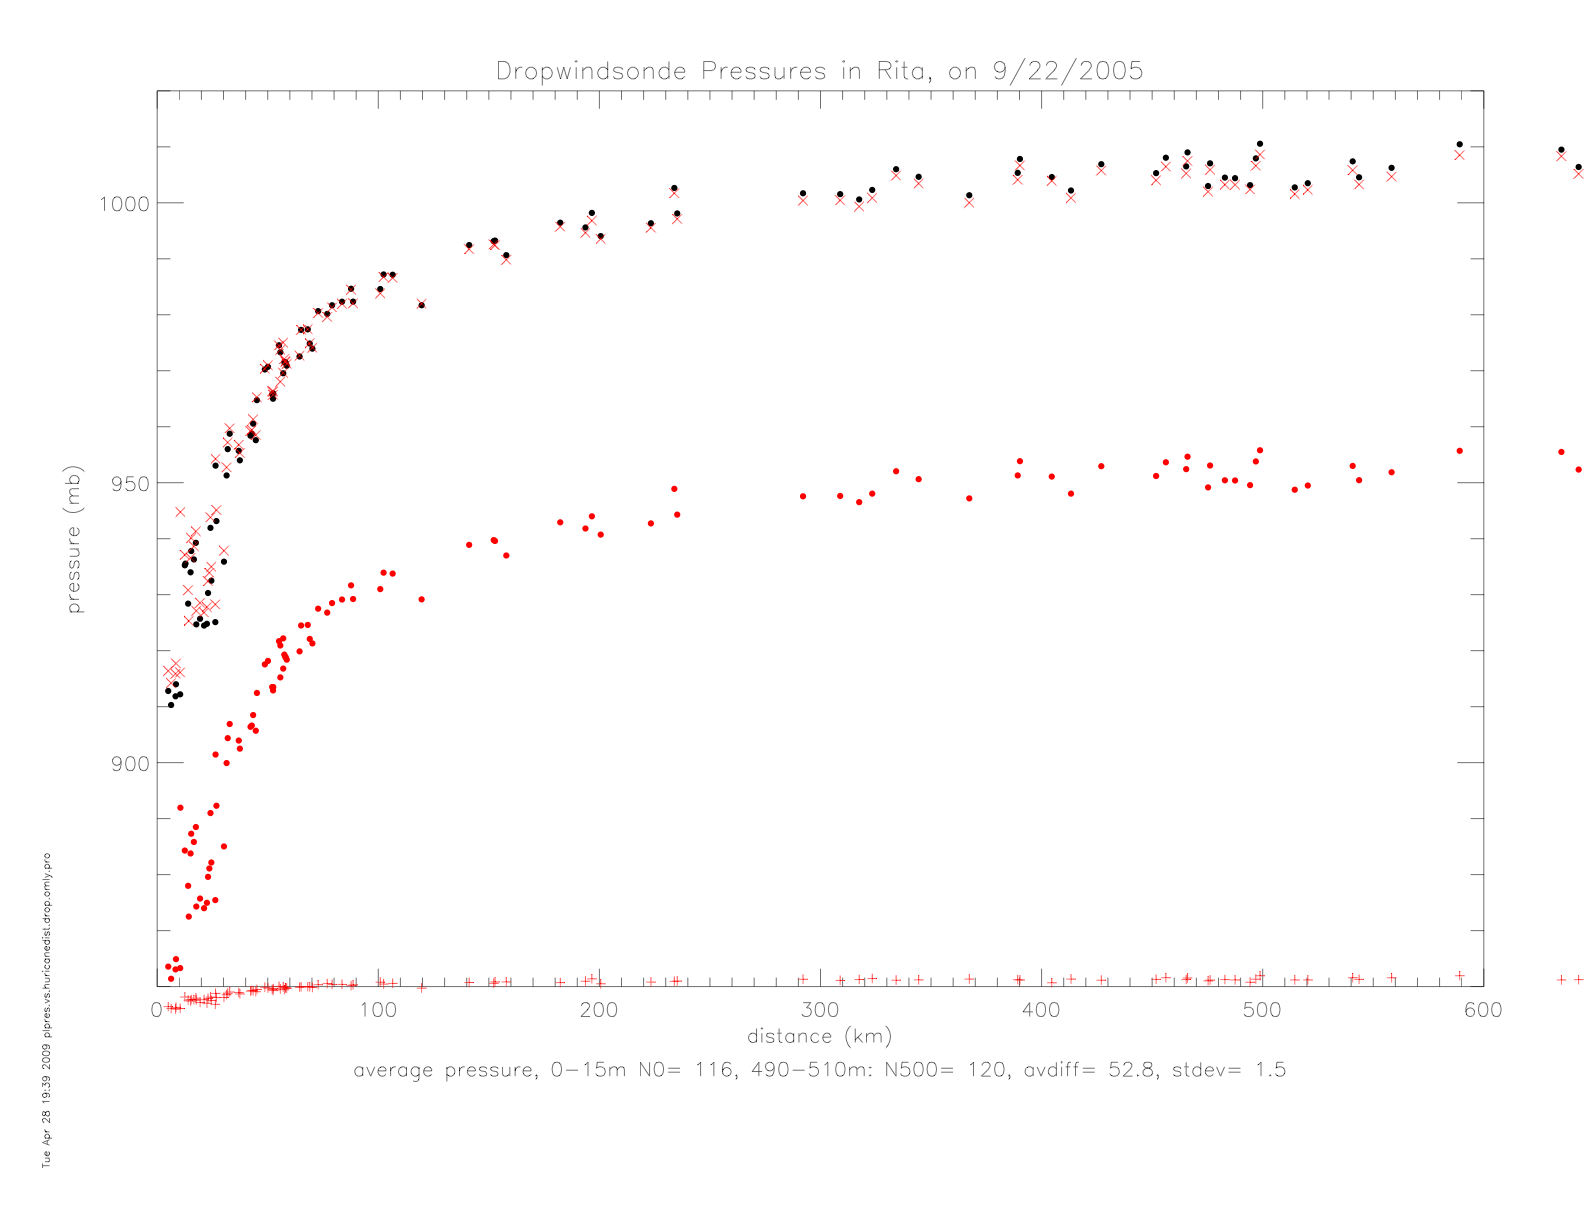
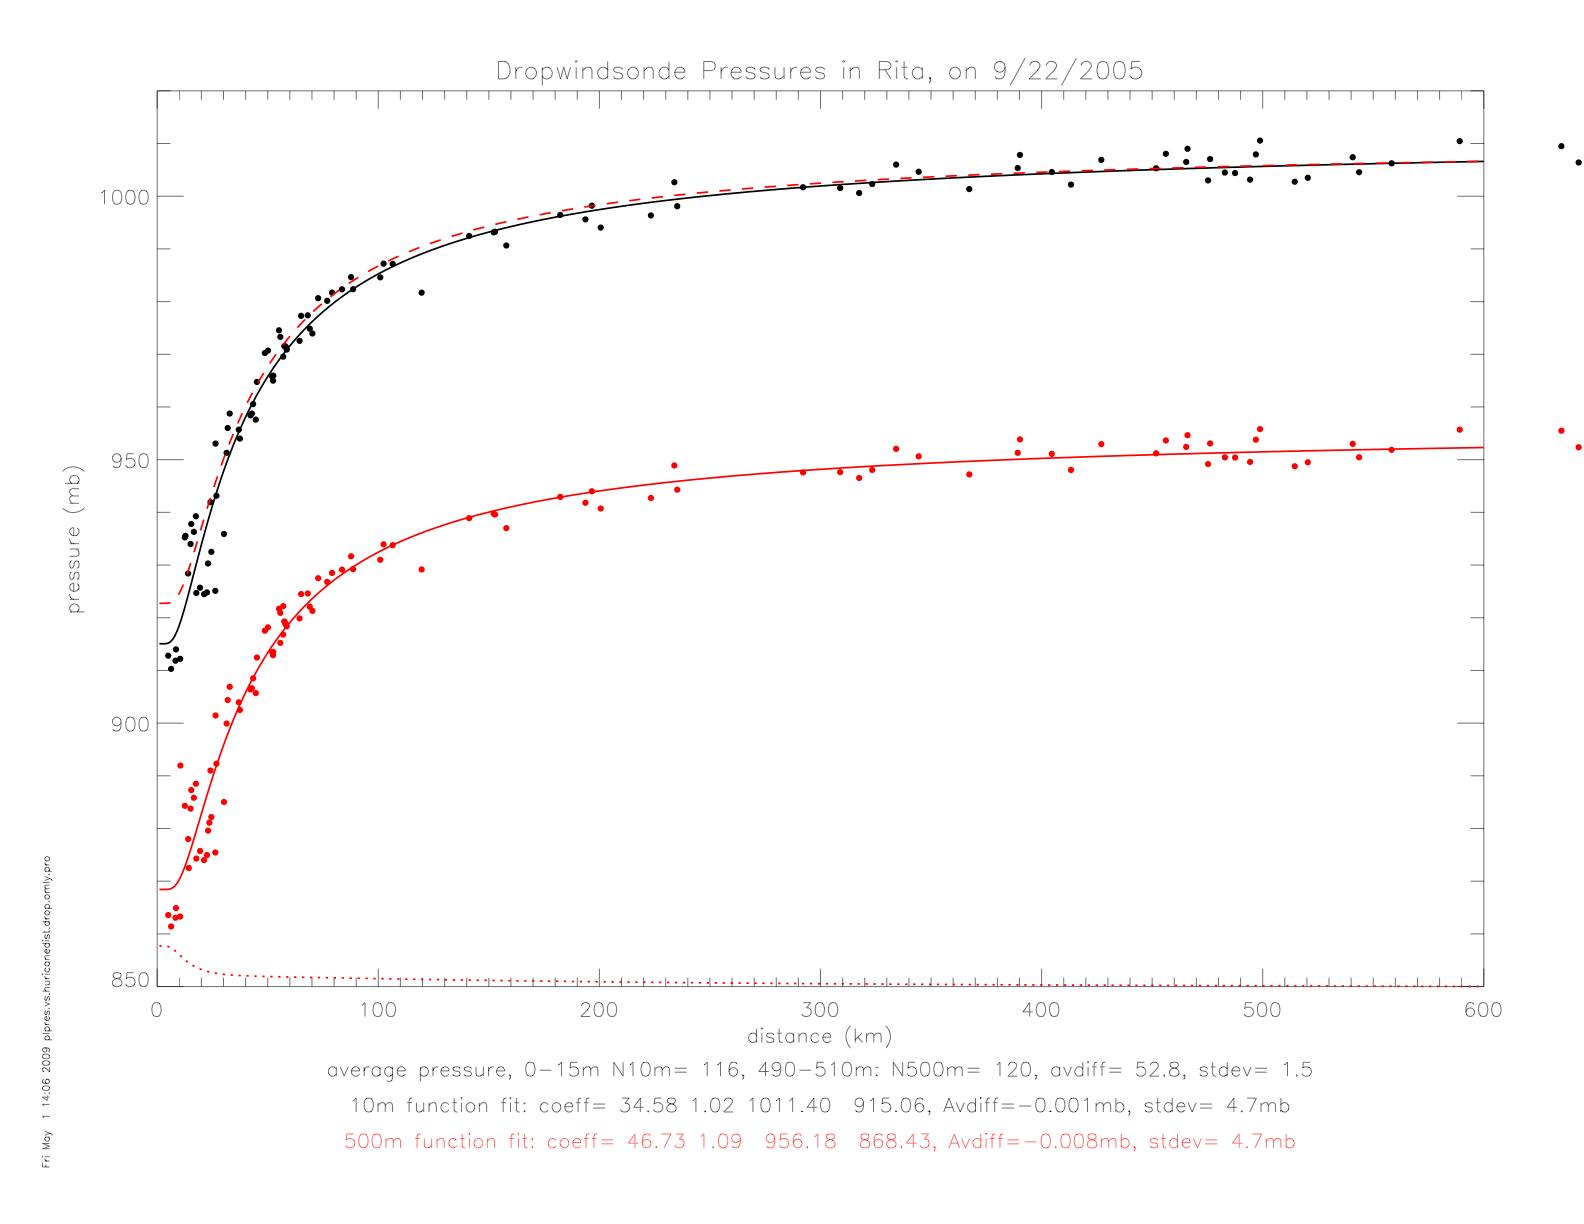
In the following figures, the dropwindsonde air pressure data are presented. They are calculated as 10m averages (averaged over 0-15m) and 500m averages (averaged over 490-510m). The figure on the left shows those averages in black (10m) and red (500m) dots. Also plotted are the 500m values shifted by the average difference of 52.8mb (red x), and the difference of the two levels (as red +). The figure on the right, shows exponential fits to the two data sets. For comparison, the 500m fit is shown shifted to match the 10m at 600km (red dashed line), and the difference is shown as a red dotted line.
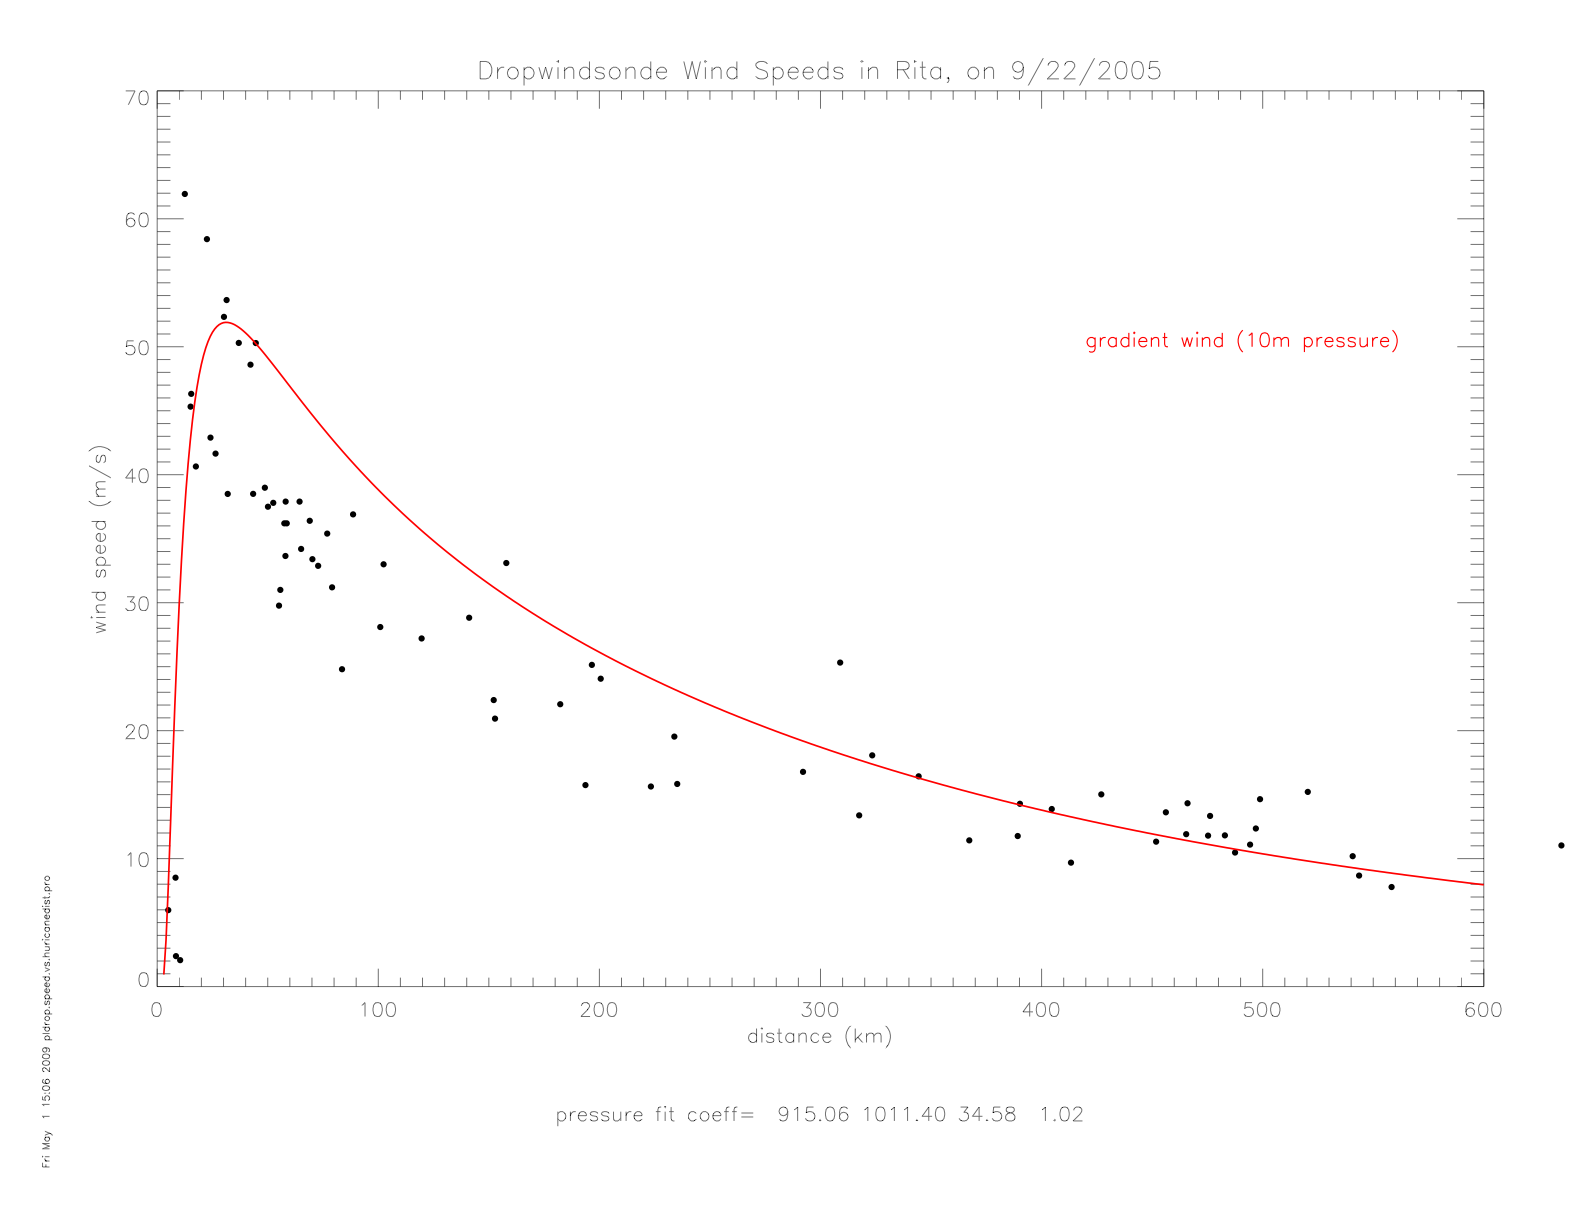
Using the observed pressure observations, the gradient wind solution can be compared with the observed wind speed data. This is shown for the 10m data (averaged over 0-15m).
Abstract (describes the basic observations and results of the momentum balances in both directions)
Fig. 2 (a,b,c) Pressure plots as function of radius for all three hurricanes
Fig. 3 Fits to pressure as function of radius
(Is there a universal scaling for pressure so that all three hurricane data fall on the same graph? Lets try the lowest central pressure for non-dimensionalizing the pressure and a radius of maximum wind speed(?) for non-dimensionalizing the radial distance)
Fig. 5 Location of center of Fabian from QSCAT and NOAA/visible
Fig. 6 (a) Comparison of wind speed from all wind drifters with QSCAT; (b) direction after biases were removed on individual drifters (perhaps we need to show TABLE.1 of what these biases were)
Fig. 8 (a) The wind direction as function of radius; (b) The radial wind component
Fig. 9 (a) The azimuthal momentum convergence; (b) The scale height, h. for azimuthal stress
Fig.10 Adjustments to azimuthal wind component due to neglecting radial stress and radial momentum advection
Fig. 11 Comparison of, h, with scale heights for humidity, density, etc. from dropsondes.