Drifters in Hurricane Rita, September 2005
Drifters
On September 21, 2005, 20 Scripps drifting buoys were deployed by the 53rd WRS squadron ahead of Hurricane Rita in the Gulf of Mexico.
This deployment is the most successful to date - all twenty drifters survived the air drop and the passage of the hurricane, and are
sending data! There are 12 Minimets and 8 ADOS, reporting air pressure, SST, wind direction and wind speed. The 8 ADOS drifters are
equipped with 100m thermistor chains. All the following figures are based on preliminary data - no quality control applied.
Quality controlled data files for all 20 drifters are available here:
Rita Drifter Data .
Table of Contents
1. Drifter Tracks
2. Drifter SST
3. Drifter Air Pressure
4. Drifter Wind Speed
5. Drifter and QSCAT Wind Speed and Direction
6. Drifter Winds and QSCAT Swaths
The figures were last updated with data up to 9/26/2005 00:00UTC.
For the following figures, click on the images for enlarged versions of plots.
1. Drifter Tracks during hurricane Rita
Solid dots indicate deployment locations. The numbers represent the last two digits of the WMO drifter ID numbers. The 3-hourly track data of Rita is shown
as a solid line. The deployment locations were based on the forecast track of Rita, as of 9/20 11pm EDT. This forecast is indicated with
a dashed line. Forecast and actual hurricane centers at 00:00UTC at consecutive days are indicated. Colors of drifter tracks in the detailed plot
(fig. 1.1.b) are the same as in the next following figures of drifter sensor data.
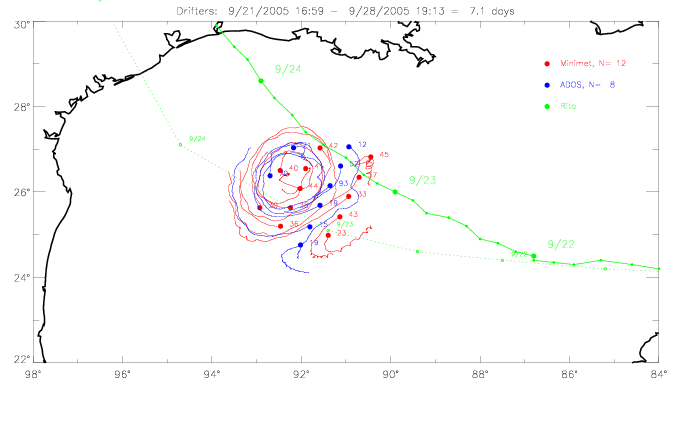
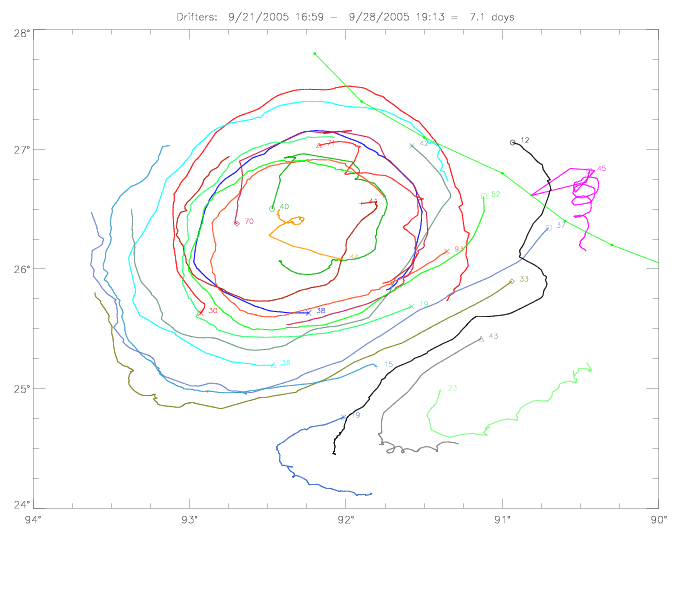 Fig. 1.1 Drifter tracks and track of hurricane Rita, (a) larger, and (b) detailed map.
2. Drifter SST during hurricane Rita
The time series of SST observations are presented below for all drifters. The SST minimum from each
drifter is indicated on the figure, as well as the observed decrease in SST. The two drifters with the
largest drop in SST are Minimet 41945 (SST change of -3.3° C) and ADOS 41612 (-2.1° C). These changes occured over the first 42 hours
after deployment.
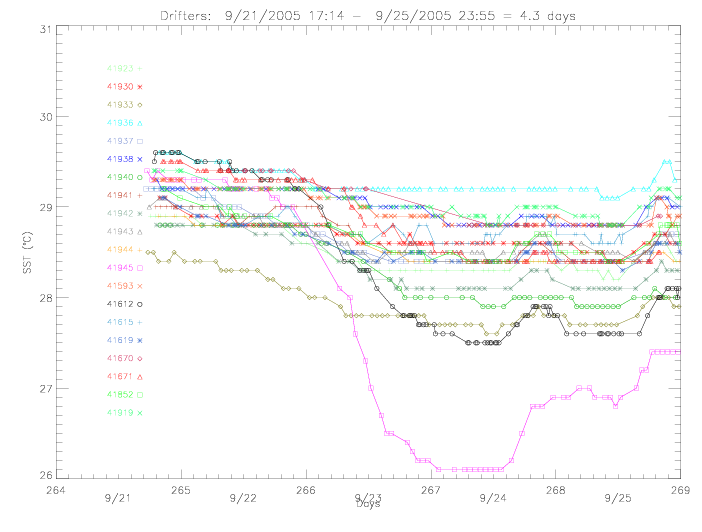
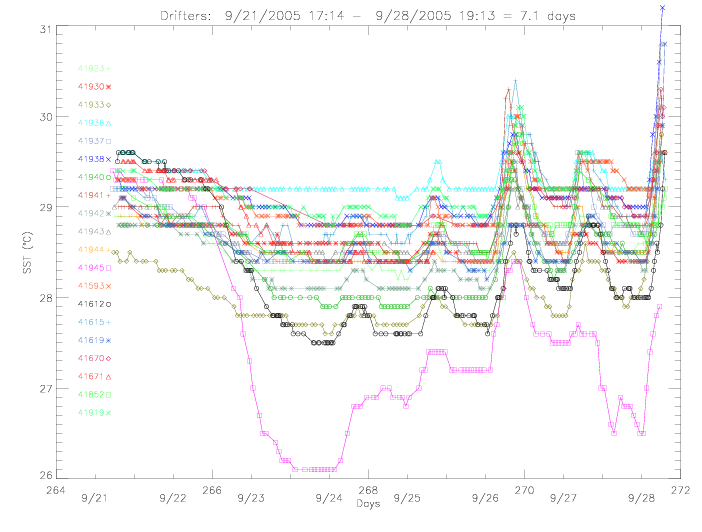 Fig. 2.1 Drifter observed SST, during the first (a) 4 days and (b) 7 days.
3. Drifter Air Pressure during hurricane Rita
The time series of of air pressure observations are presented below for all drifters. The pressure minimum from each
drifter is indicated on the figure. The two drifters with the
lowest pressures in their time series are Minimet 41945 (926mb) and ADOS 41612 (938mb). Their deployment locations are to the right of the
hurricane path.
Also shown are three days for drifters 41945, 41612, and 41671. These drifters recorded the largest pressure drops.
Drifter 41945 displays a few data measurement cycles with, as it seems, anomalous pressure fluctuations after the
encounter with the center of the hurricane at a minimum distance of 12km (during days 266.4 - 266.8).
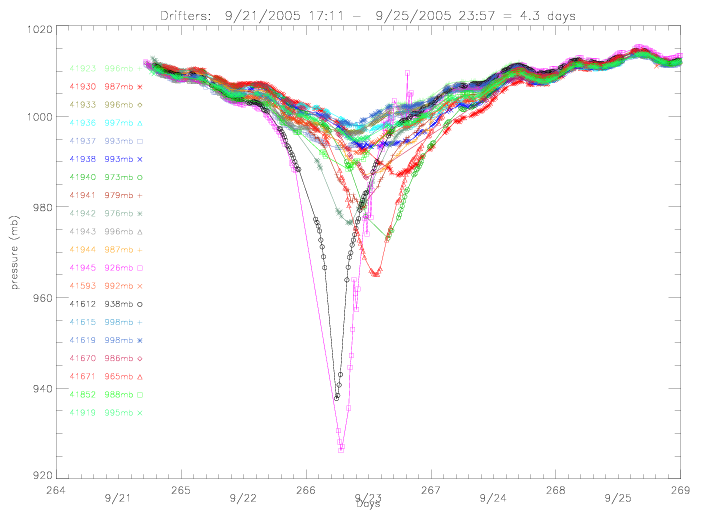
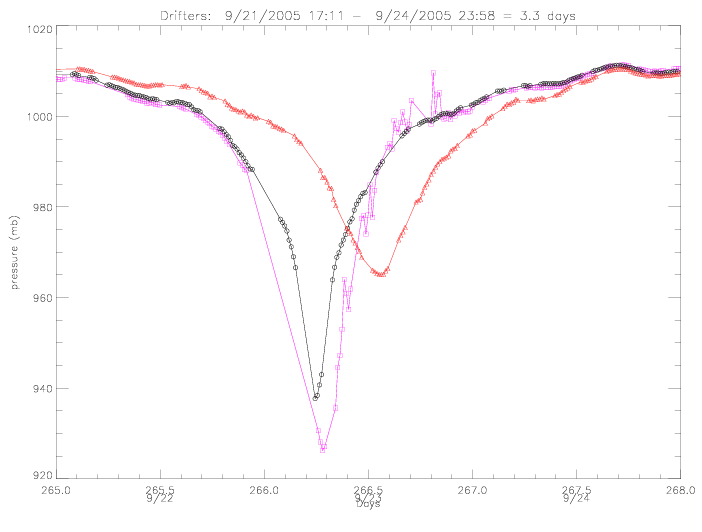 Fig. 3.1 Drifter observed sealevel pressure: (a) all drifters during the first 4 days, and
(b) 3 drifters during 3 days.
Fig. 3.1 Drifter observed sealevel pressure: (a) all drifters during the first 4 days, and
(b) 3 drifters during 3 days.
In the next figure, drifter pressure observations are plotted with respect to distance to center of Rita.
An exponential fit to the data is computed:
pressure = f(distance) = p0 + (pe-p0) · e-(a/distb) ,
where p0 is specified as 920mb, and the other coefficients are found to be: pe=1018.62mb, a=22.67, and b=0.84.
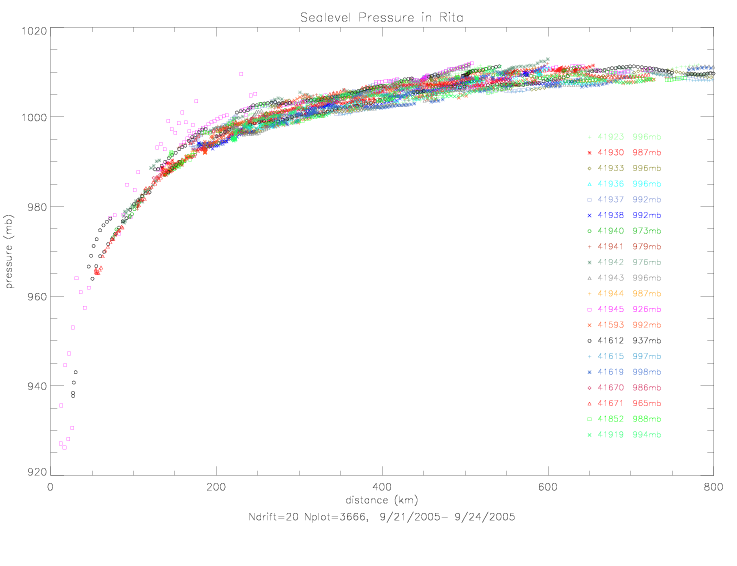
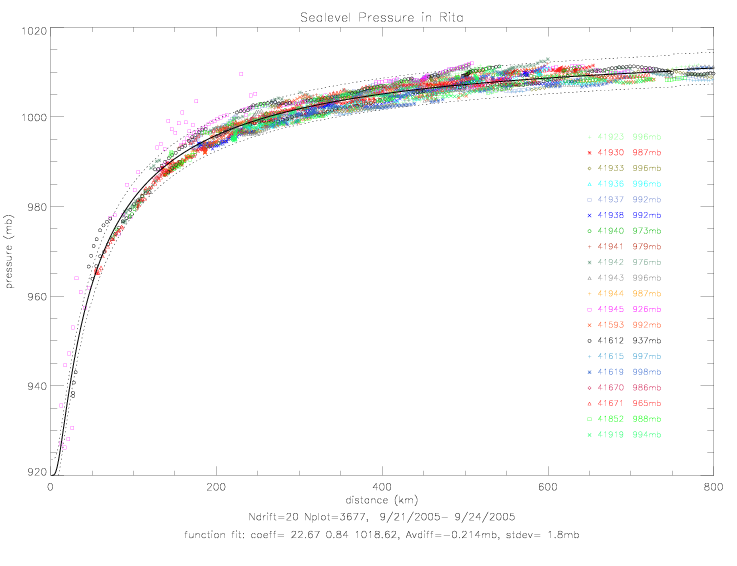 Fig. 3.2 Drifter sealevel pressure vs. distance to hurricane center: (a) all drifters, and
(b) with exponential fit (Stdev. indicated with dotted lines).
Fig. 3.2 Drifter sealevel pressure vs. distance to hurricane center: (a) all drifters, and
(b) with exponential fit (Stdev. indicated with dotted lines).
4. Drifter Wind Speed during hurricane Rita
Drifters measured surface wind speed by measuring acoustic sound pressure under water. The following plots compare
drifter wind speeds with collocated QSCAT data. Drifter and QSCAT observations were collocated when both measurements were
made within 1 hour and 100km. On average, the collocations were made within 8min and only 11km apart. The scatterometer
signal has been flagged for rain.
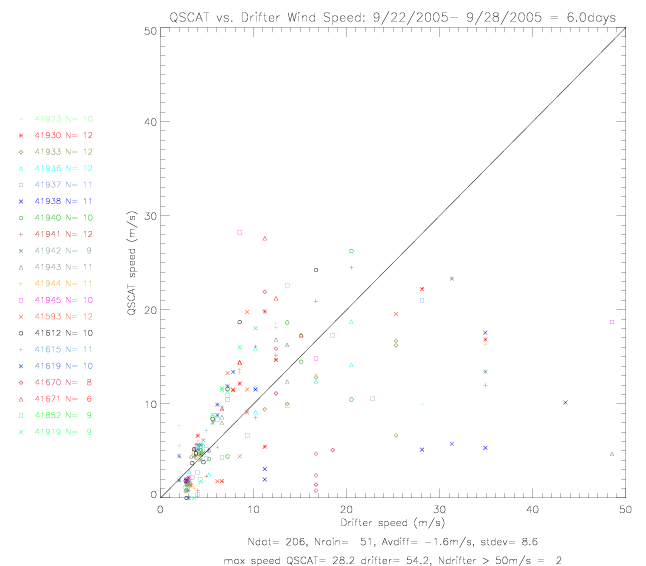
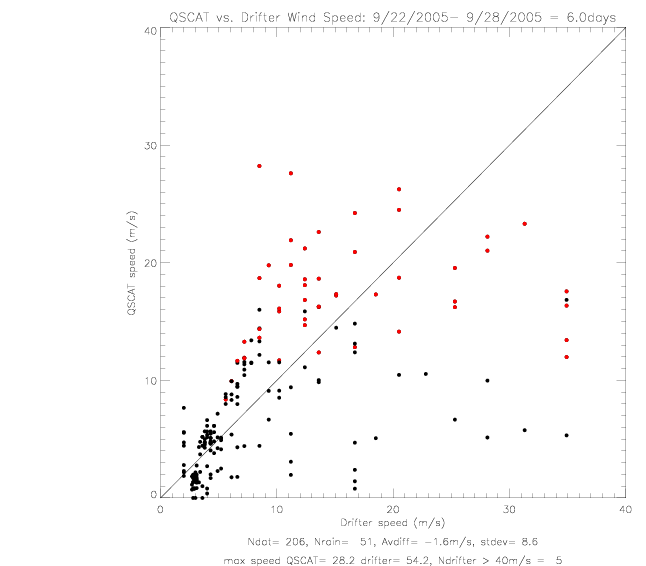 Fig. 4.1 Drifter and QSCAT wind speeds, during first 6 days, (a) drifters labeled, and (b) rain-flagged QSCAT data.
The wind speeds reported by drifters deployed in Rita, show anomalously high scatter. The reason for the
failure of the acoustic sensors is not well understood at this time.
*** It is recommended, therefore, not to use any speed data from the Rita drifters. ***
5. Drifter and QSCAT Wind Speed and Direction (hourly averages)
In the following twenty figures, all drifter observed wind speeds and directions (hourly averaged) are compared with collocated QSCAT
data. The top panel shows distance to the center of hurricane Rita (in km). The second panel shows wind speed
(collocated QSCAT in red, rain-flagged data as open squares). The third panel shows wind speed differences
(drifter-QSCAT); average differences and rms are printed on the plot. The fourth panel shows wind directions.
And the last panel shows direction differences. In the direction difference panel, the average difference and rms
for all data is printed, as well as for a sub-sample of differences less than 120° ("SUB"). When data in the sub-sample
are adjusted for the computed offset, the resulting rms of the adjusted wind directions is also indicated.
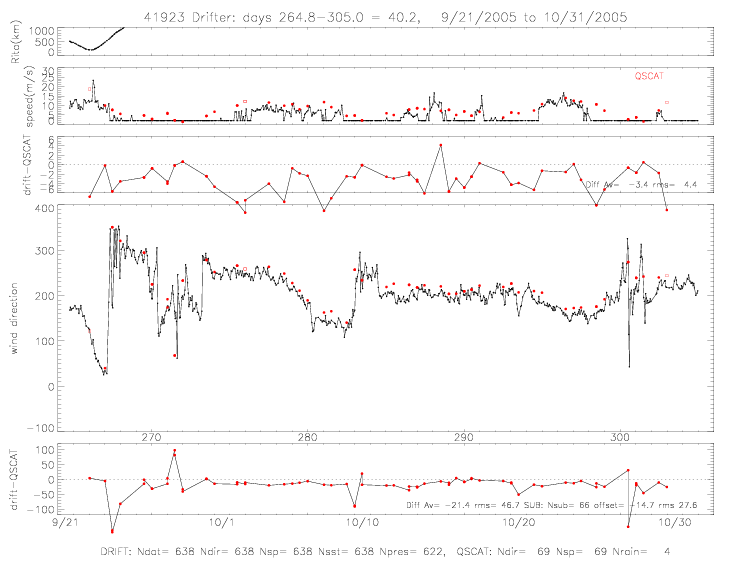
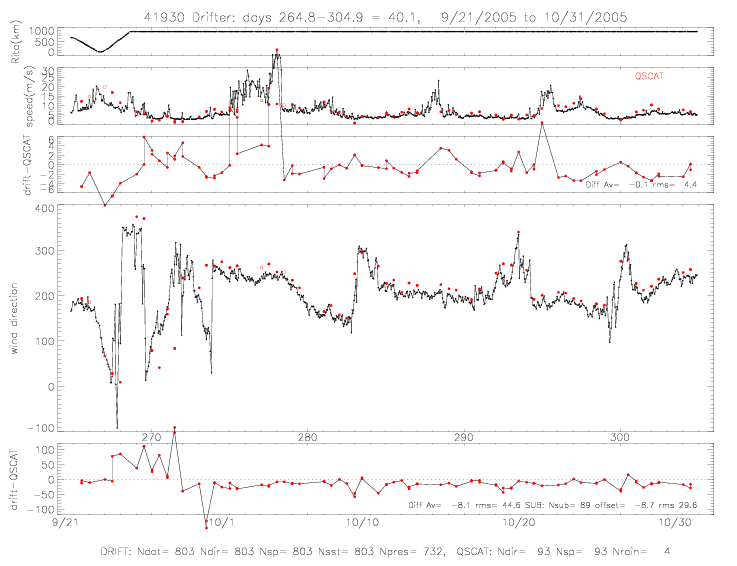 Fig. 5.1 Drifter (a) 41923 and (b) 41930, wind speed and directions.
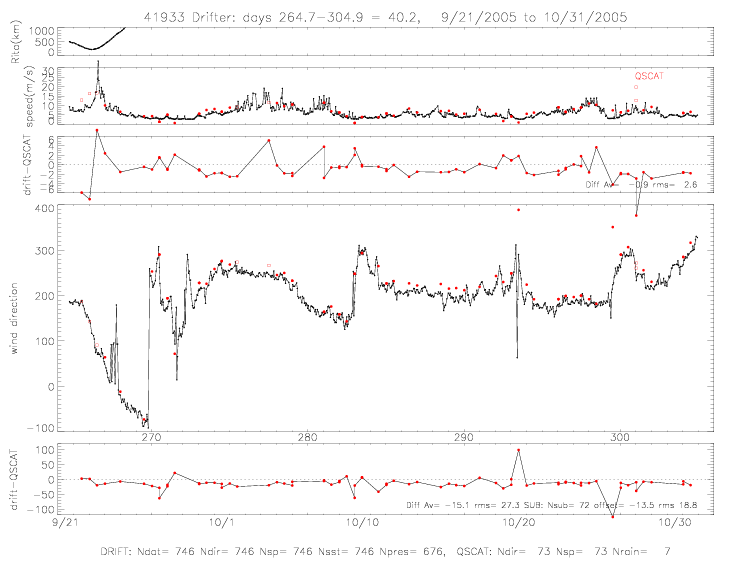
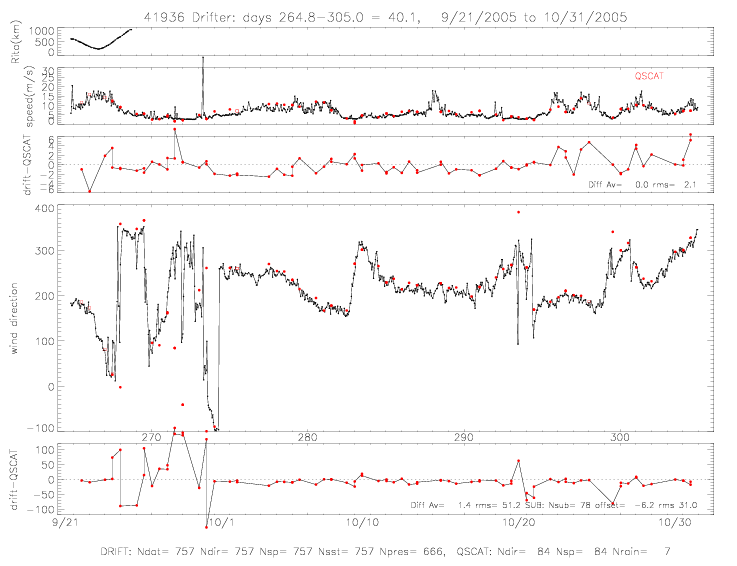 Fig. 5.2 Drifter (a) 41933 and (b) 41936, wind speed and directions.
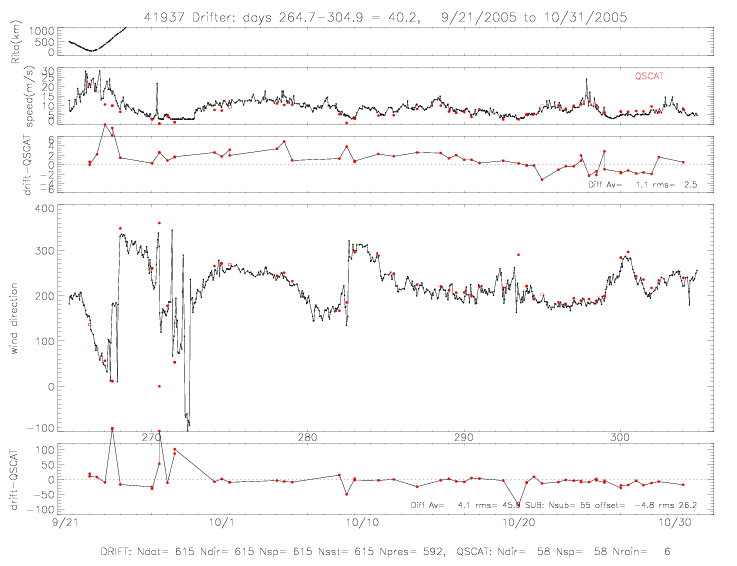
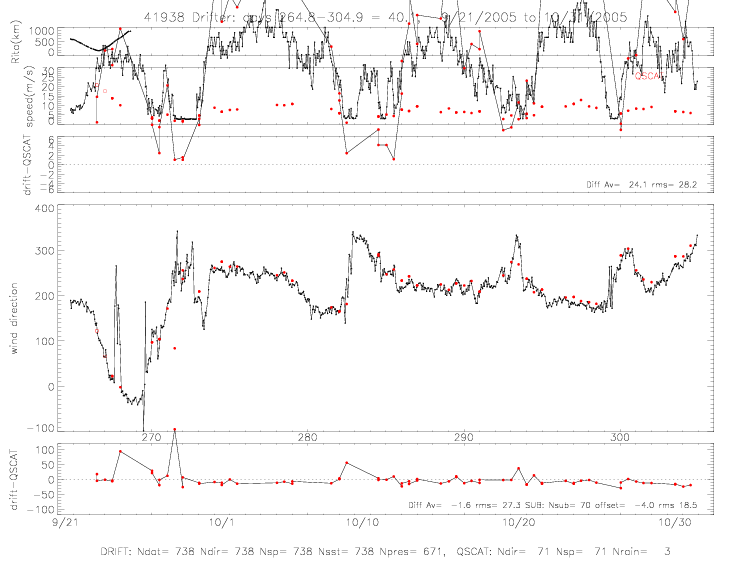 Fig. 5.3 Drifter (a) 41937 and (b) 41938, wind speed and directions.
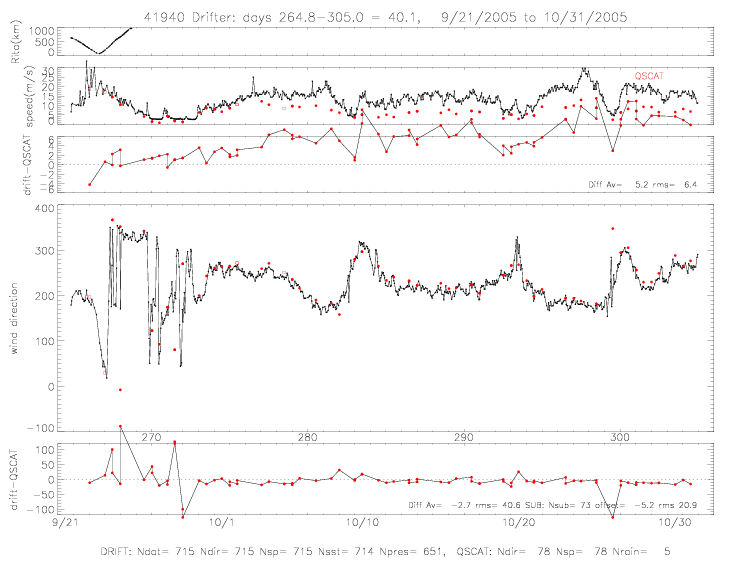
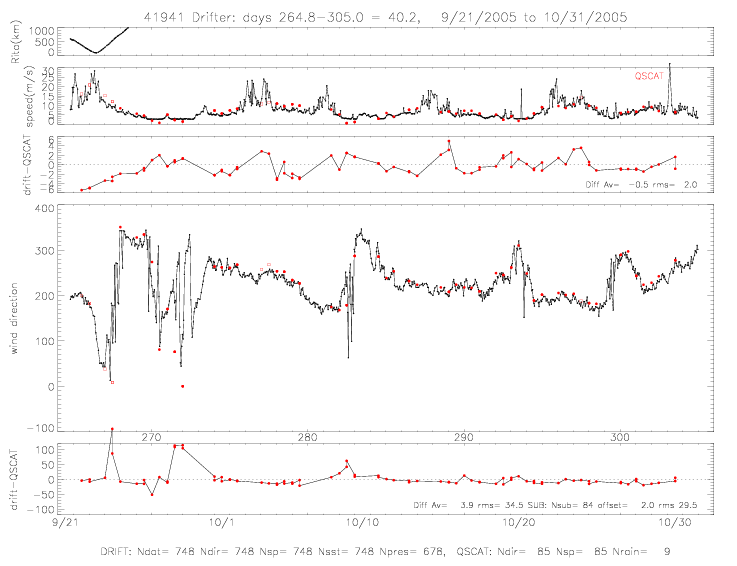 Fig. 5.4 Drifter (a) 41940 and (b) 41941, wind speed and directions.
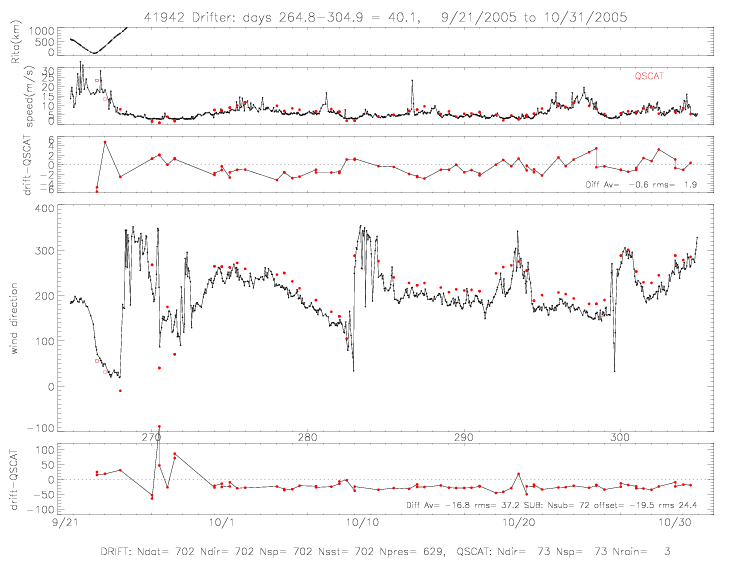
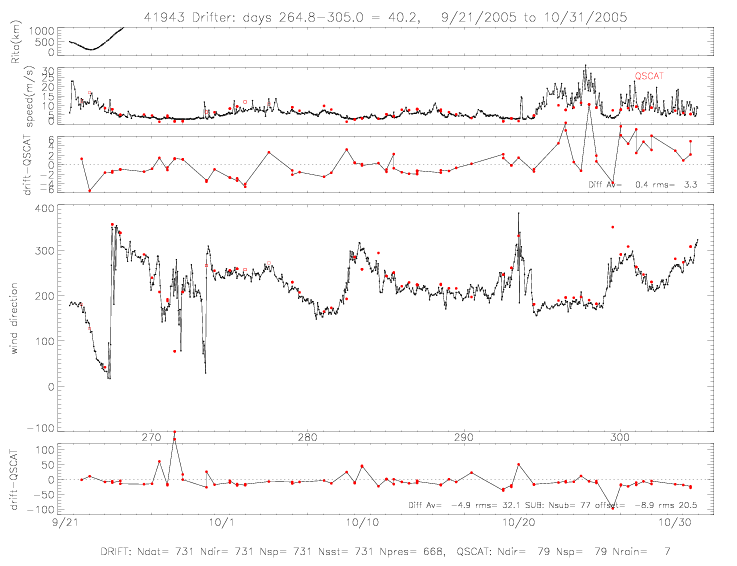 Fig. 5.5 Drifter (a) 41942 and (b) 41943, wind speed and directions.
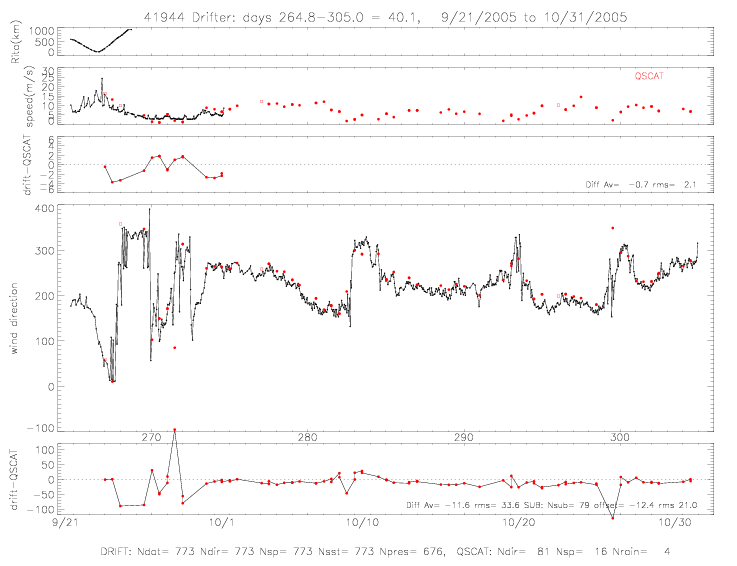
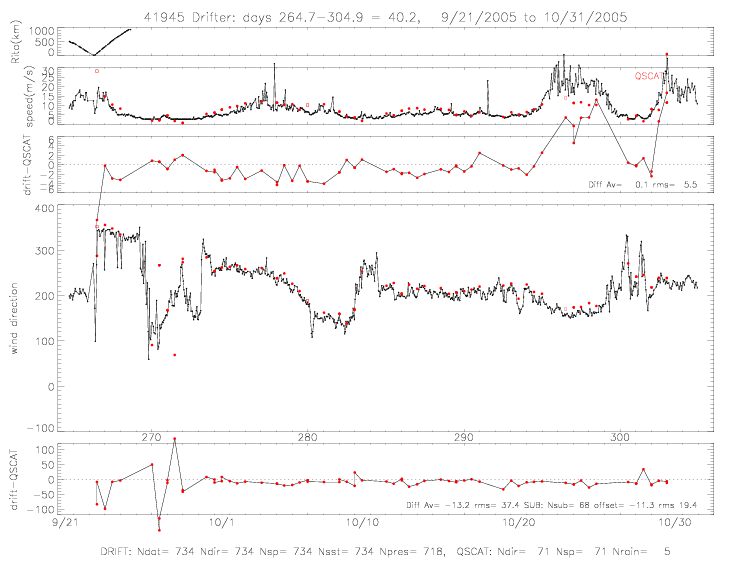 Fig. 5.6 Drifter (a) 41944 and (b) 41945, wind speed and directions.
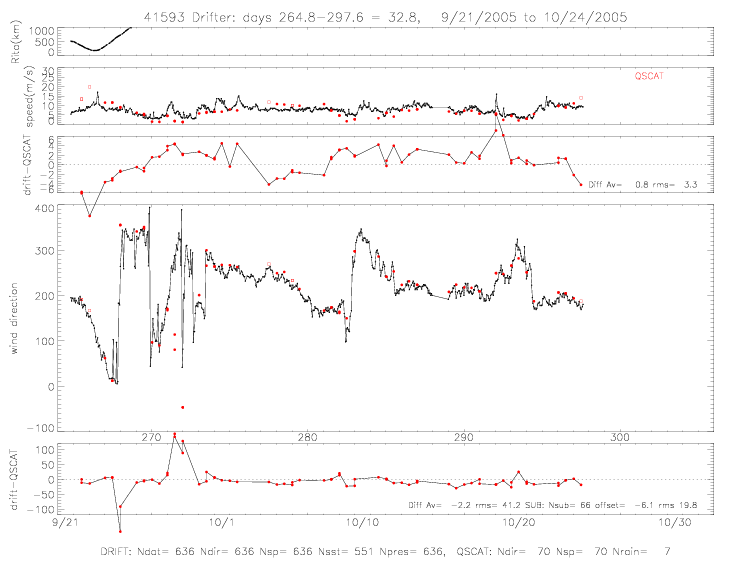
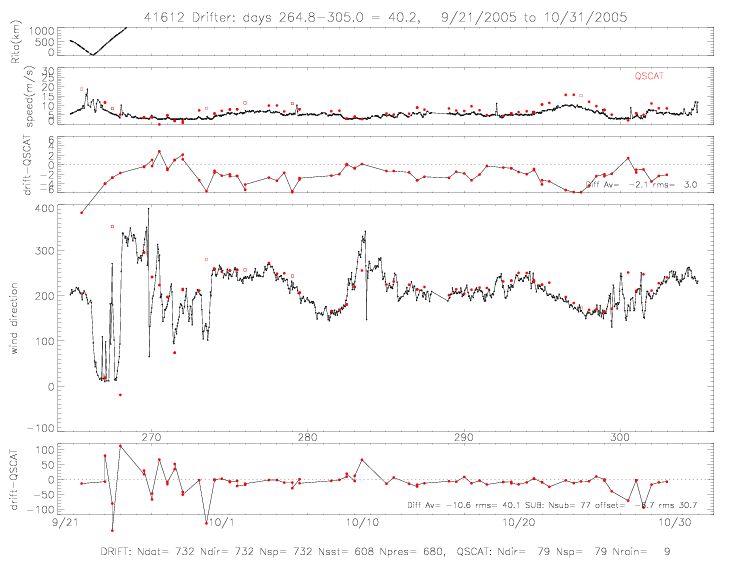 Fig. 5.7 Drifter (a) 41593 and (b) 41612, wind speed and directions.
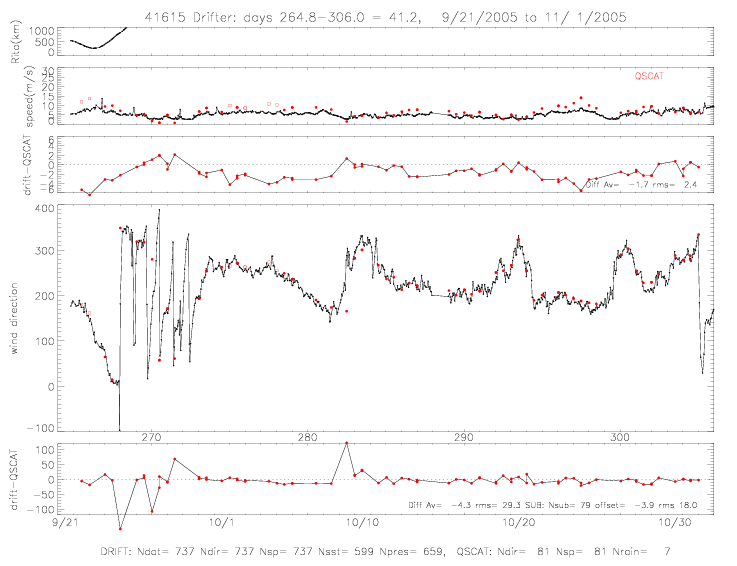
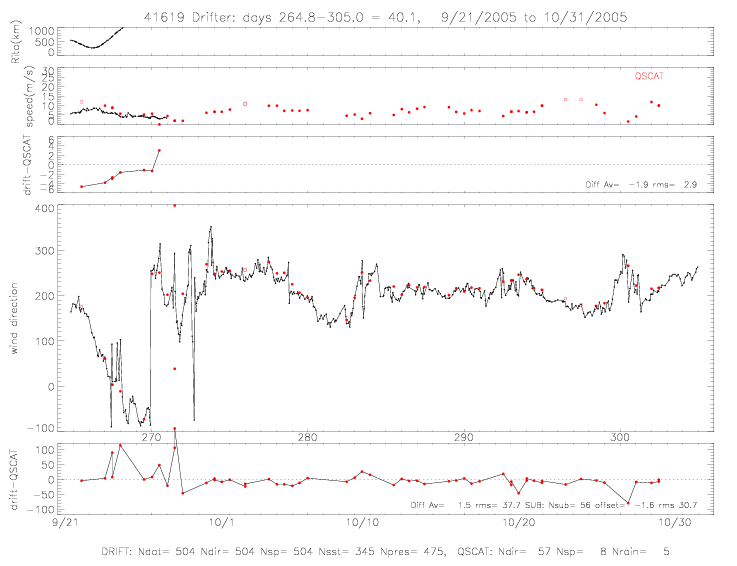 Fig. 5.8 Drifter (a) 41615 and (b) 41619, wind speed and directions.
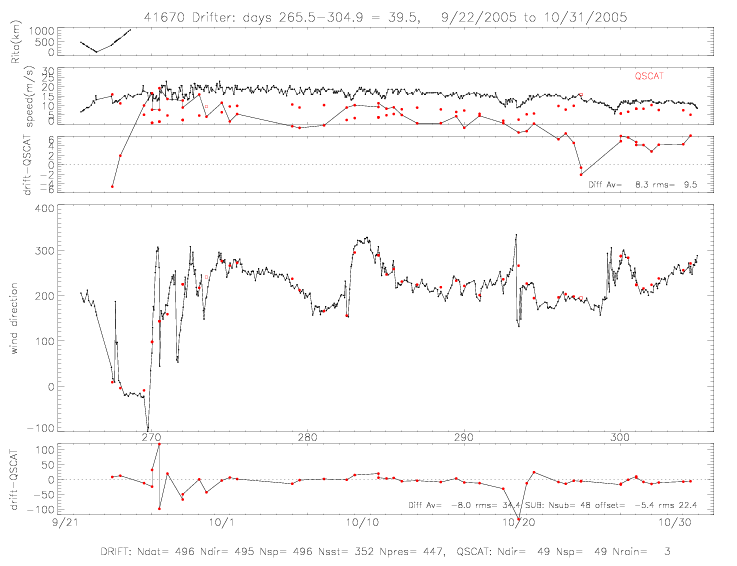
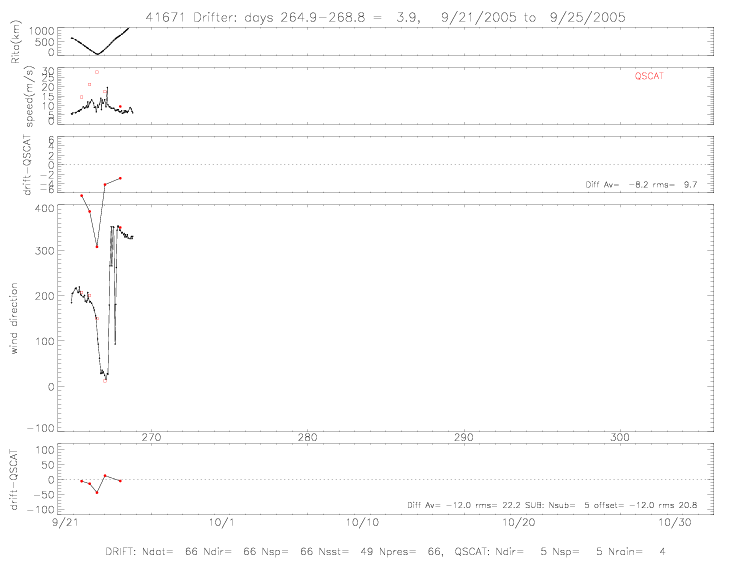 Fig. 5.9 Drifter (a) 41670 and (b) 41671, wind speed and directions.
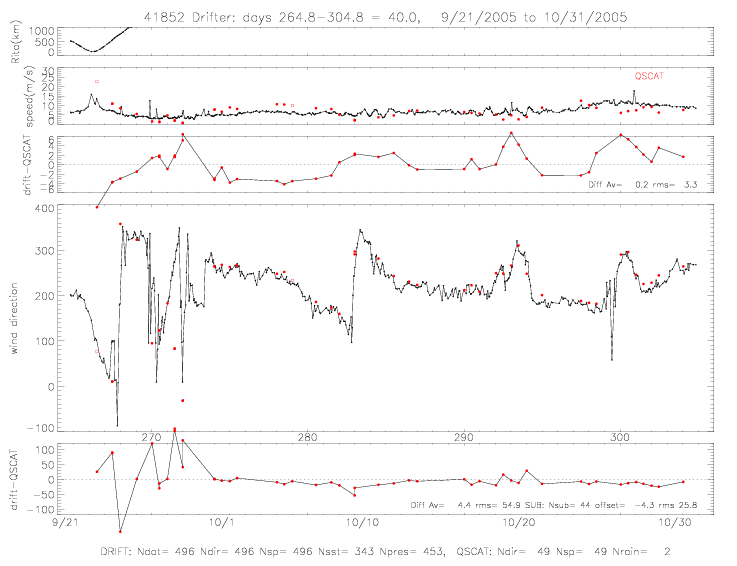
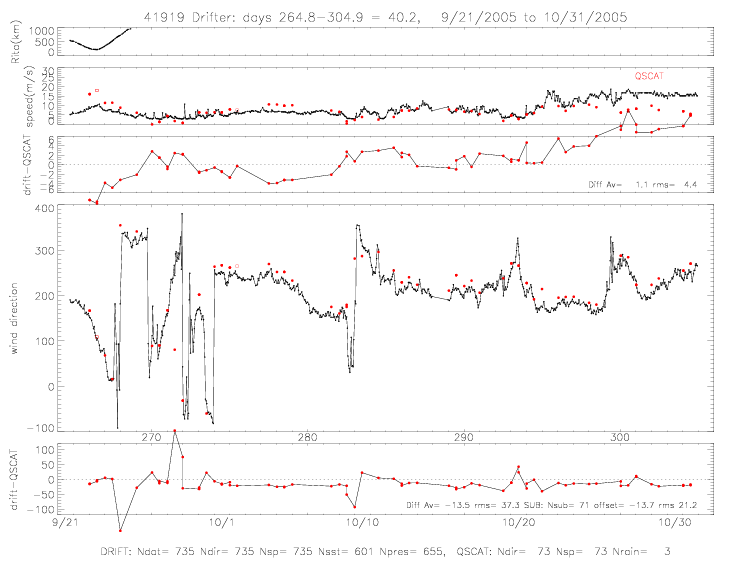 Fig. 5.10 Drifter (a) 41852 and (b) 41919, wind speed and directions.
Wind speed and direction differences are summarized in table 5.1. The sub-samples of direction differences,
refer to data when the differences are less than 120° and drifter data have been adjusted by the indicated offsets.
Table 5.1: Wind speed and direction differences (drifter-QSCAT)
| | Number of Data |
Speed |
Direction |
Direction sub-sample |
| Drifter | days | N |
av Diff | rms | comment |
av Diff | rms |
Nsub | offset | rms |
| 41923 | 40 | 69 | -3.4 | 4.4 | bad | -21 | 47 | 66 | -15 | 28 |
| (a) 41930 | 40 | 93 | -0.9 | 2.7 | | - 8 | 45 | 89 | - 9 | 30 |
| 41933 | 40 | 73 | -0.9 | 2.6 | | -15 | 27 | 72 | -14 | 19 |
| 41936 | 40 | 84 | 0.0 | 2.1 | good | 1 | 51 | 78 | - 6 | 31 |
| 41937 | 40 | 58 | 1.1 | 2.5 | | 4 | 46 | 55 | - 5 | 26 |
| 41938 | 40 | 71 | 24.1 | 28.2 | bad | - 2 | 27 | 70 | - 4 | 19 |
| 41940 | 40 | 78 | 5.2 | 6.4 | trend | - 3 | 41 | 73 | - 5 | 21 |
| 41941 | 40 | 85 | -0.5 | 2.0 | | 4 | 35 | 84 | 2 | 30 |
| 41942 | 40 | 73 | -0.6 | 1.9 | | -17 | 37 | 72 | -20 | 24 |
| (b) 41943 | 40 | 79 | -0.9 | 2.0 | | - 5 | 32 | 77 | - 9 | 21 |
| (c) 41944 | 40 | 81 | -0.7 | 2.1 | short | -12 | 34 | 79 | -12 | 21 |
| (d) 41945 | 40 | 71 | -1.7 | 3.6 | | -13 | 37 | 68 | -11 | 19 |
| 41593 | 33 | 70 | 0.8 | 3.3 | | - 2 | 41 | 66 | - 6 | 20 |
| 41612 | 40 | 79 | -2.1 | 3.0 | | -11 | 40 | 77 | - 7 | 31 |
| 41615 | 41 | 81 | -1.7 | 2.4 | | - 4 | 29 | 79 | - 4 | 18 |
| (e) 41619 | 40 | 57 | -1.9 | 2.9 | short | 2 | 38 | 56 | - 2 | 31 |
| 41670 | 40 | 49 | 8.3 | 9.5 | bad | - 8 | 34 | 48 | - 5 | 22 |
| 41671 | 4 | | | | short | | | | | |
| 41852 | 40 | 49 | 0.2 | 3.3 | trend | 4 | 55 | 44 | - 4 | 26 |
| 41919 | 40 | 73 | 1.1 | 4.4 | trend | -14 | 37 | 71 | -14 | 21 |
For speed: (a) exclude days 275-278.3, (b) only first 21 days, (c) first 10 days, (d) first 21 days, (e) first 6 days;
bad = erratic speed, good = very good speed, trend = trend in speed, short = very short speed record.
6. Drifter Winds and QSCAT swaths
QSCAT revs of hurricane Rita in the Gulf of Mexico are shown in the next several figures. Rain-flagged satellite data are
plotted in red. Drifter obs within 1hr of the QSCAT data are shown in blue (last 2 digits of drifter ID labeled on plot).
Also indicated are the NOAA "best track" hurricane center (green cross) and max wind speed (in subtitle). The (blue) subtitle
for drifters indicates: 2 last digits of drifter ID, time difference from QSCAT data (in minutes), and measured wind speed
(in m/s).
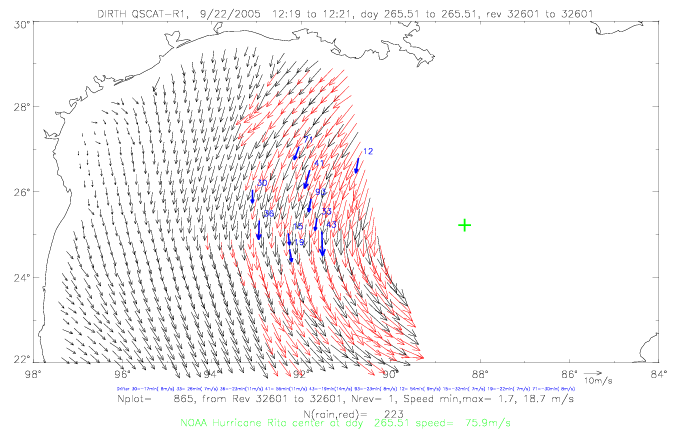
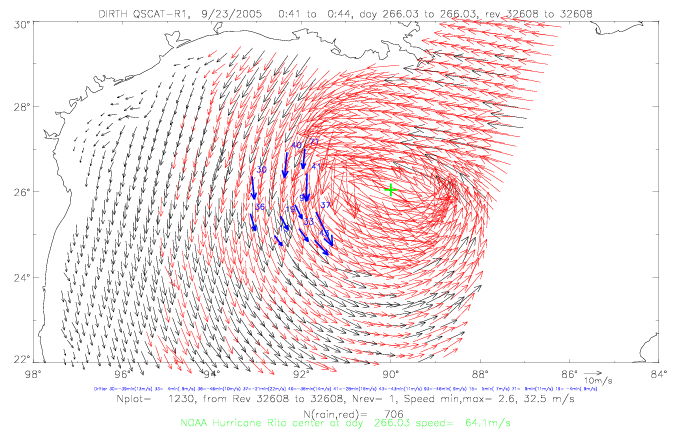 Fig. 6.1 Drifter winds and QSCAT, during (a) rev 32601 (9/22 12:20) and (b) rev 32608 (9/23 00:42).
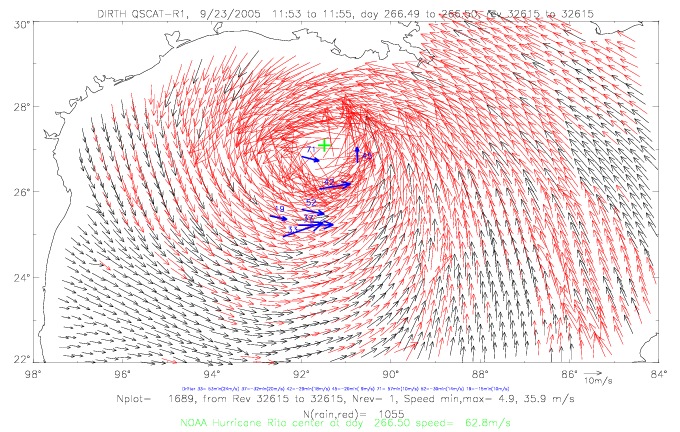
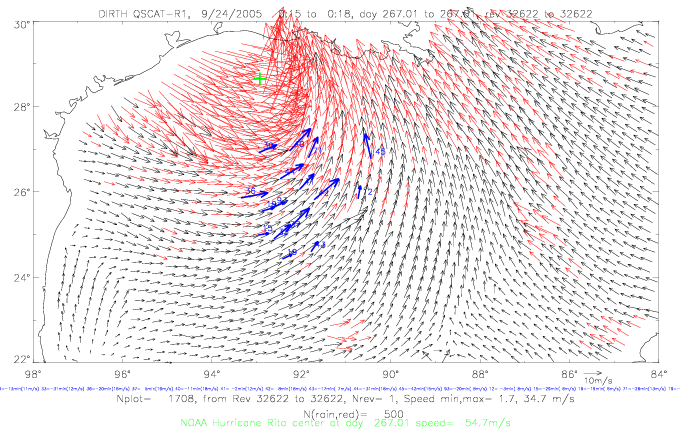 Fig. 6.2 Drifter winds and QSCAT, during (a) rev 32615 (9/23 11:54) and (b) rev 32622 (9/24 00:16).
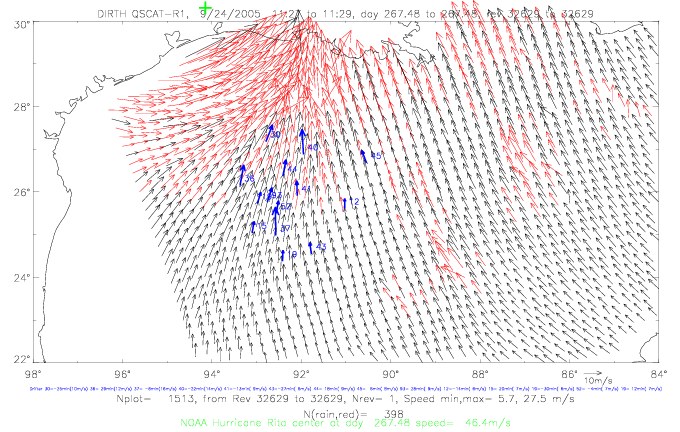
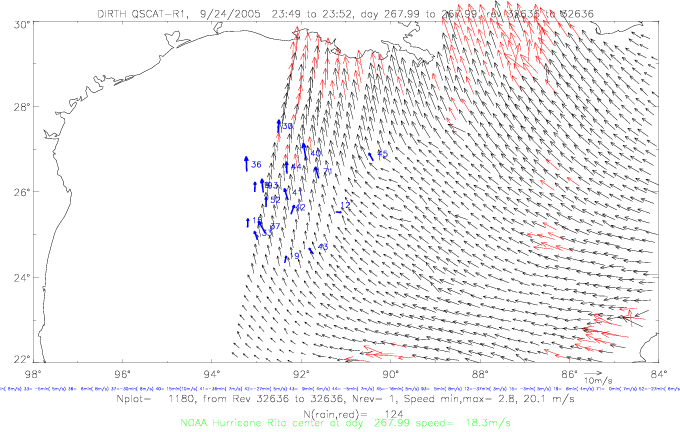 Fig. 6.3 Drifter winds and QSCAT, during (a) rev 32629 (9/24 11:28) and (b) rev 32636 (9/24 23:50).
last modified on March 13, 2009
Go Back
)
)
)
)
)
)
)
)
)
)
)
)
)
)
)
)
)
)
)
)
)
)
)
)
)
)
)
)
)
)
)
)
)
)
)
)