The goal of this project is to advance atmosphere-ocean modeling of tropical cyclones, by making observational data available for model validations in a comprehensive and easily accessible manner.
All available data are summarized in the following table. Click on the hurricane/typhoon name for analyses and graphs of selected drifter sensor data.
| Year | Ocean | Deployments | Data | |||
| 2003 | Atlantic | Fabian | 8 Drifters | |||
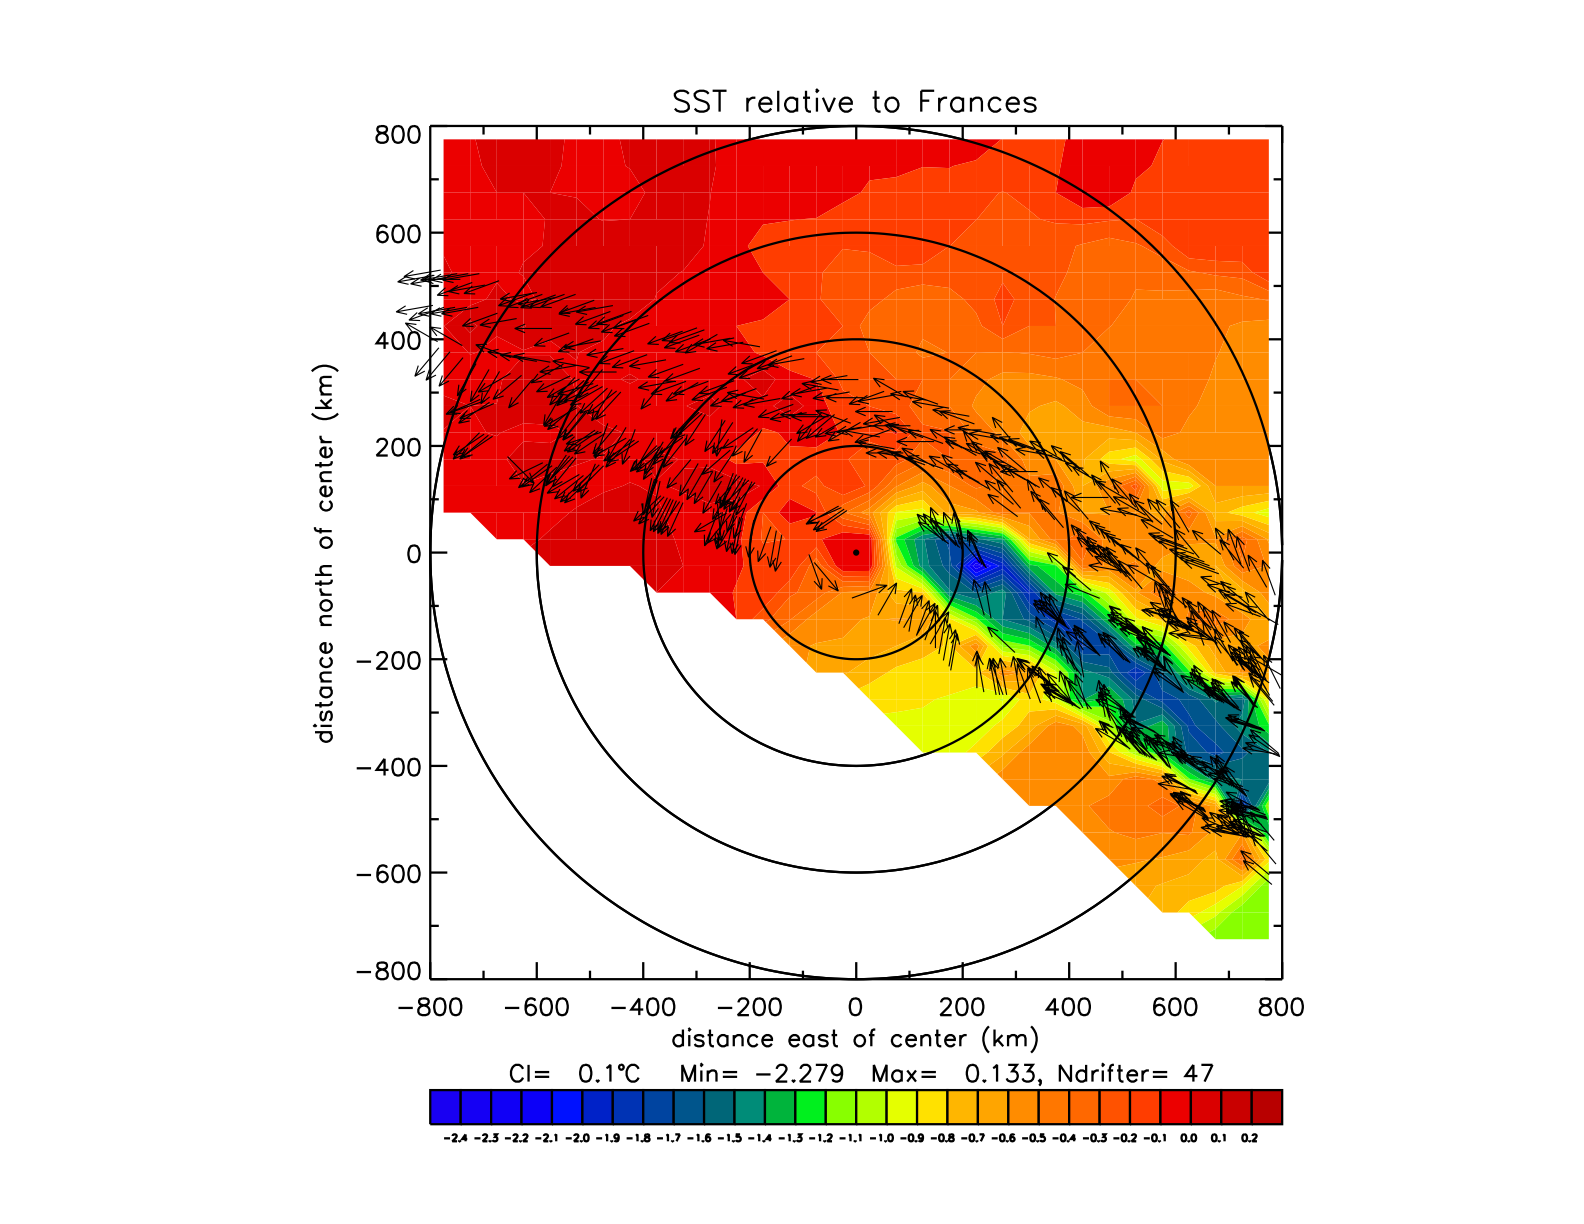
| 2004 | Atlantic | Frances | 66 Drifters | 2 Floats | ||
| 2005 | Atlantic | Rita | 20 Drifters | |||
| 2007 | Atlantic | Dean | 12 Drifters | |||
| 2008 | Atlantic | Gustav | 12 Drifters | |||
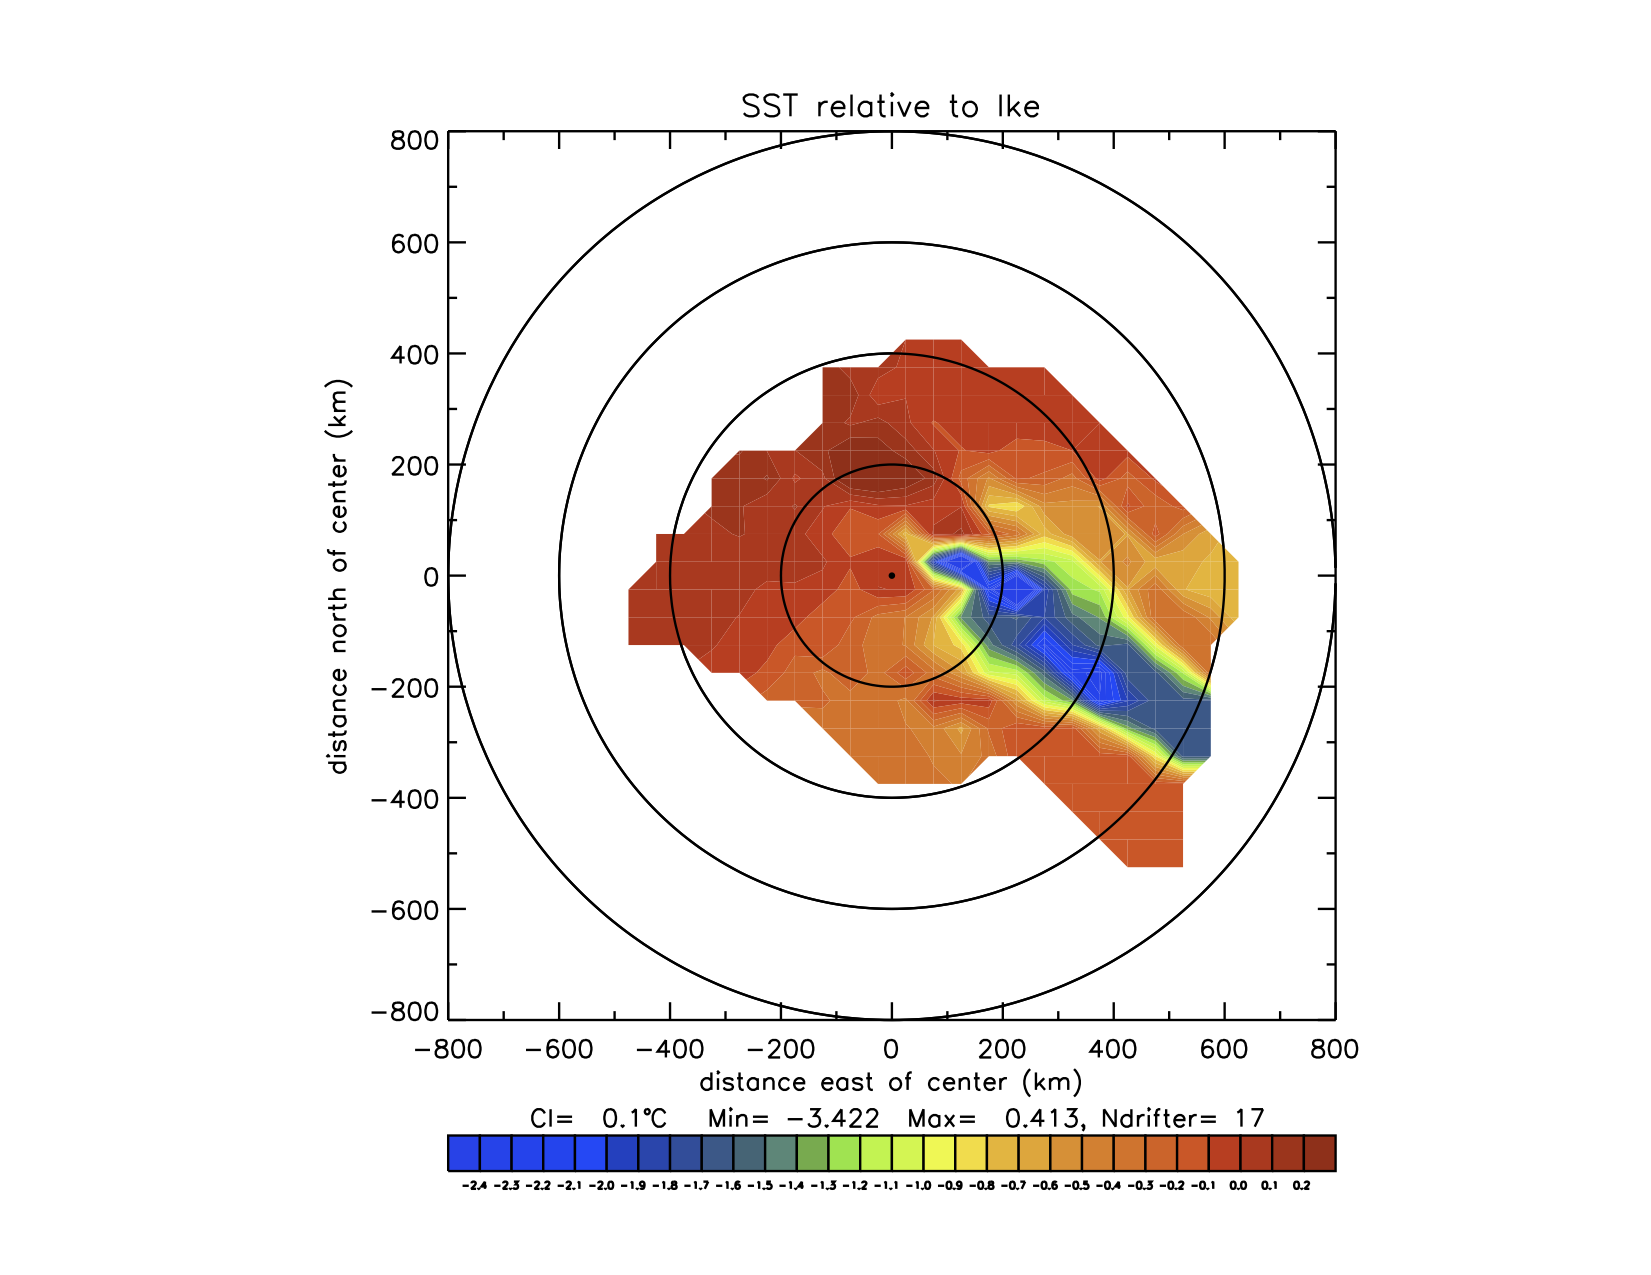
| Atlantic | Ike | 20 Drifters | ||||
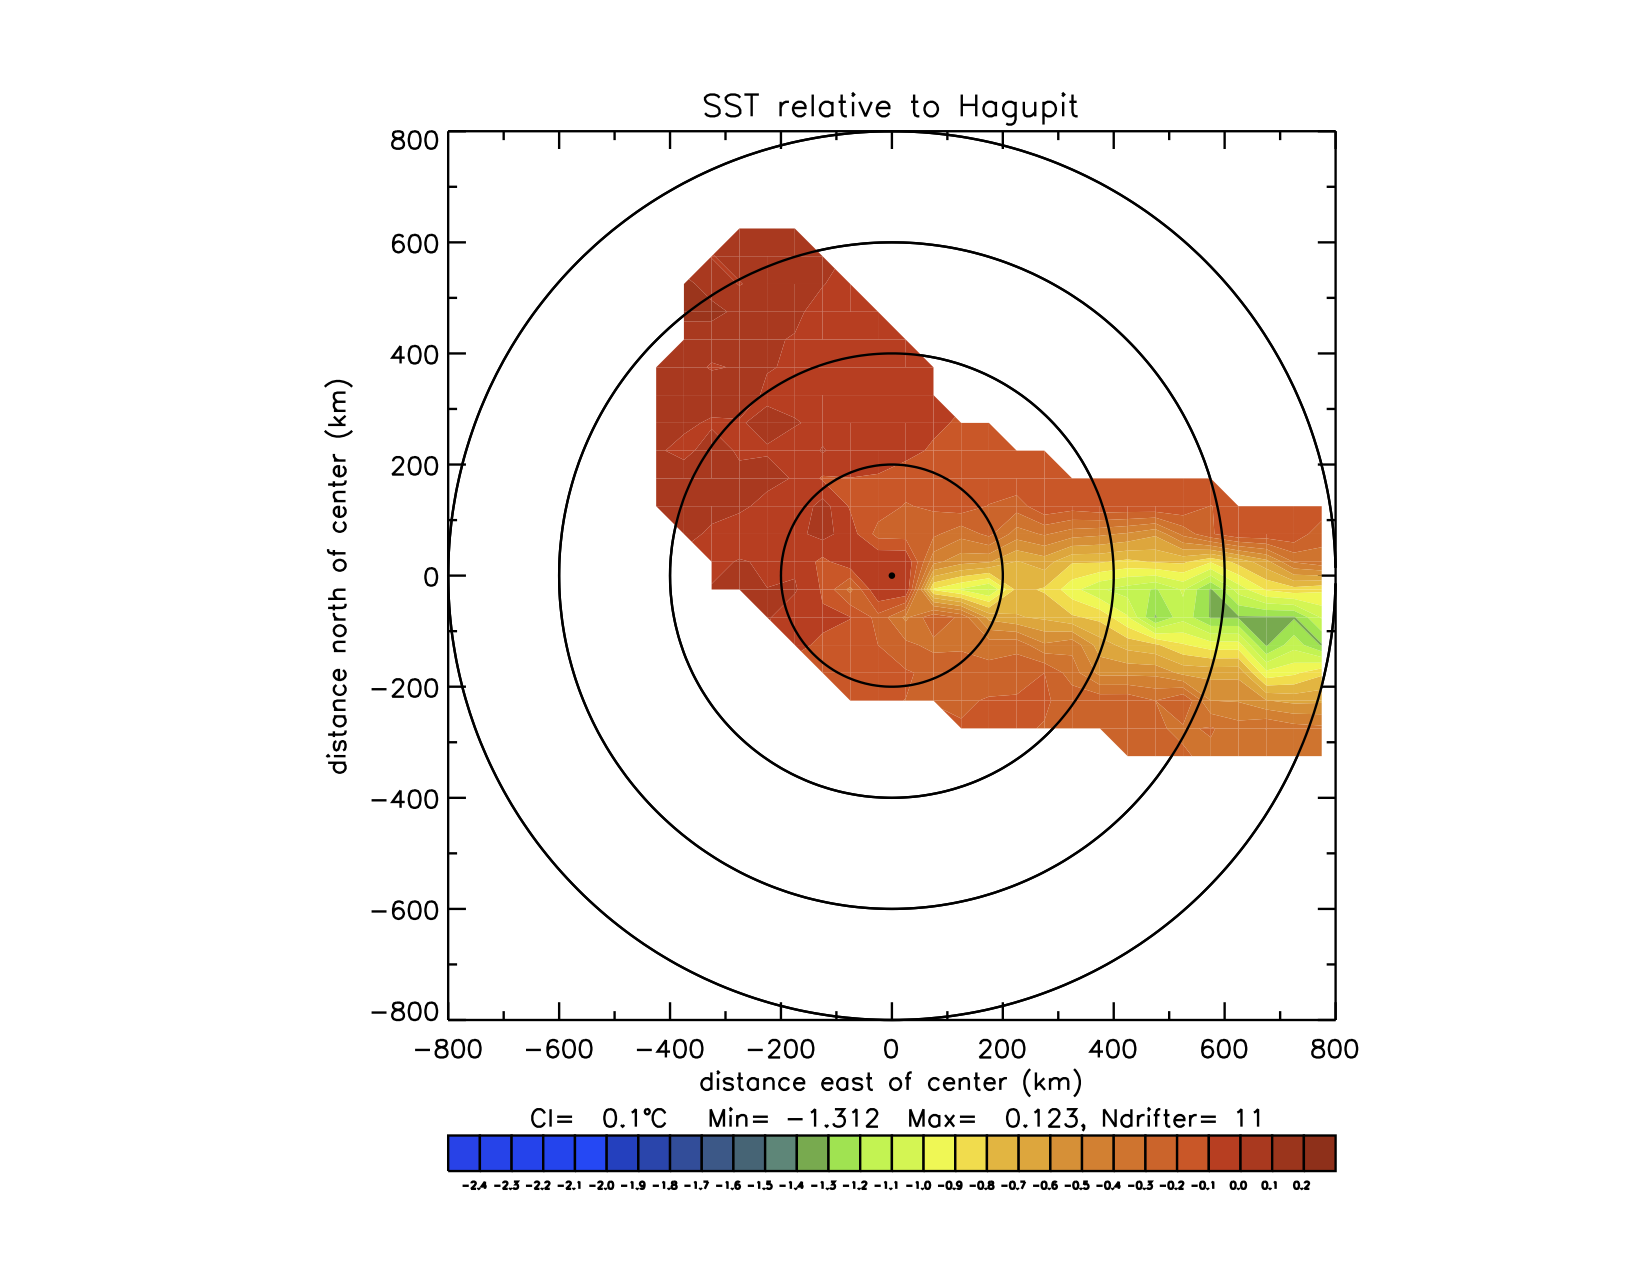
| Pacific | Hagupit | 11 Drifters | ||||
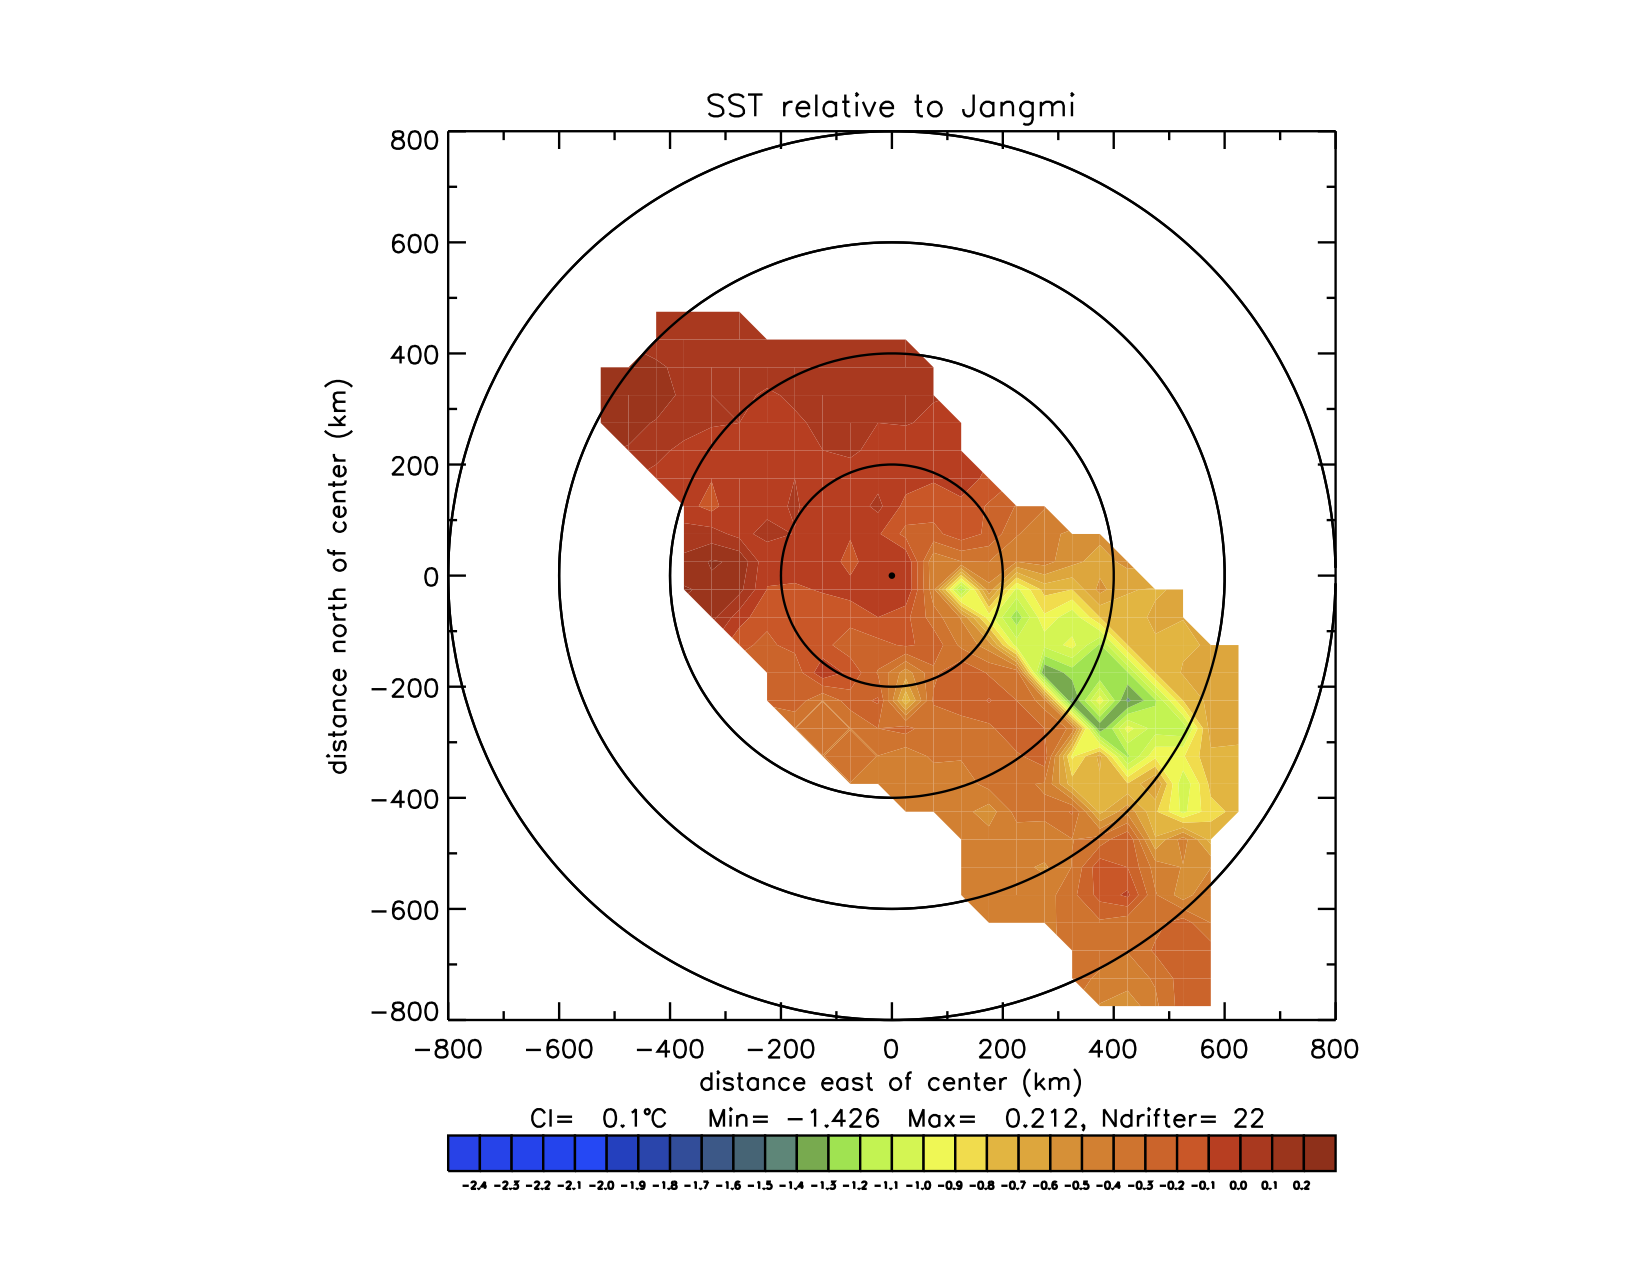
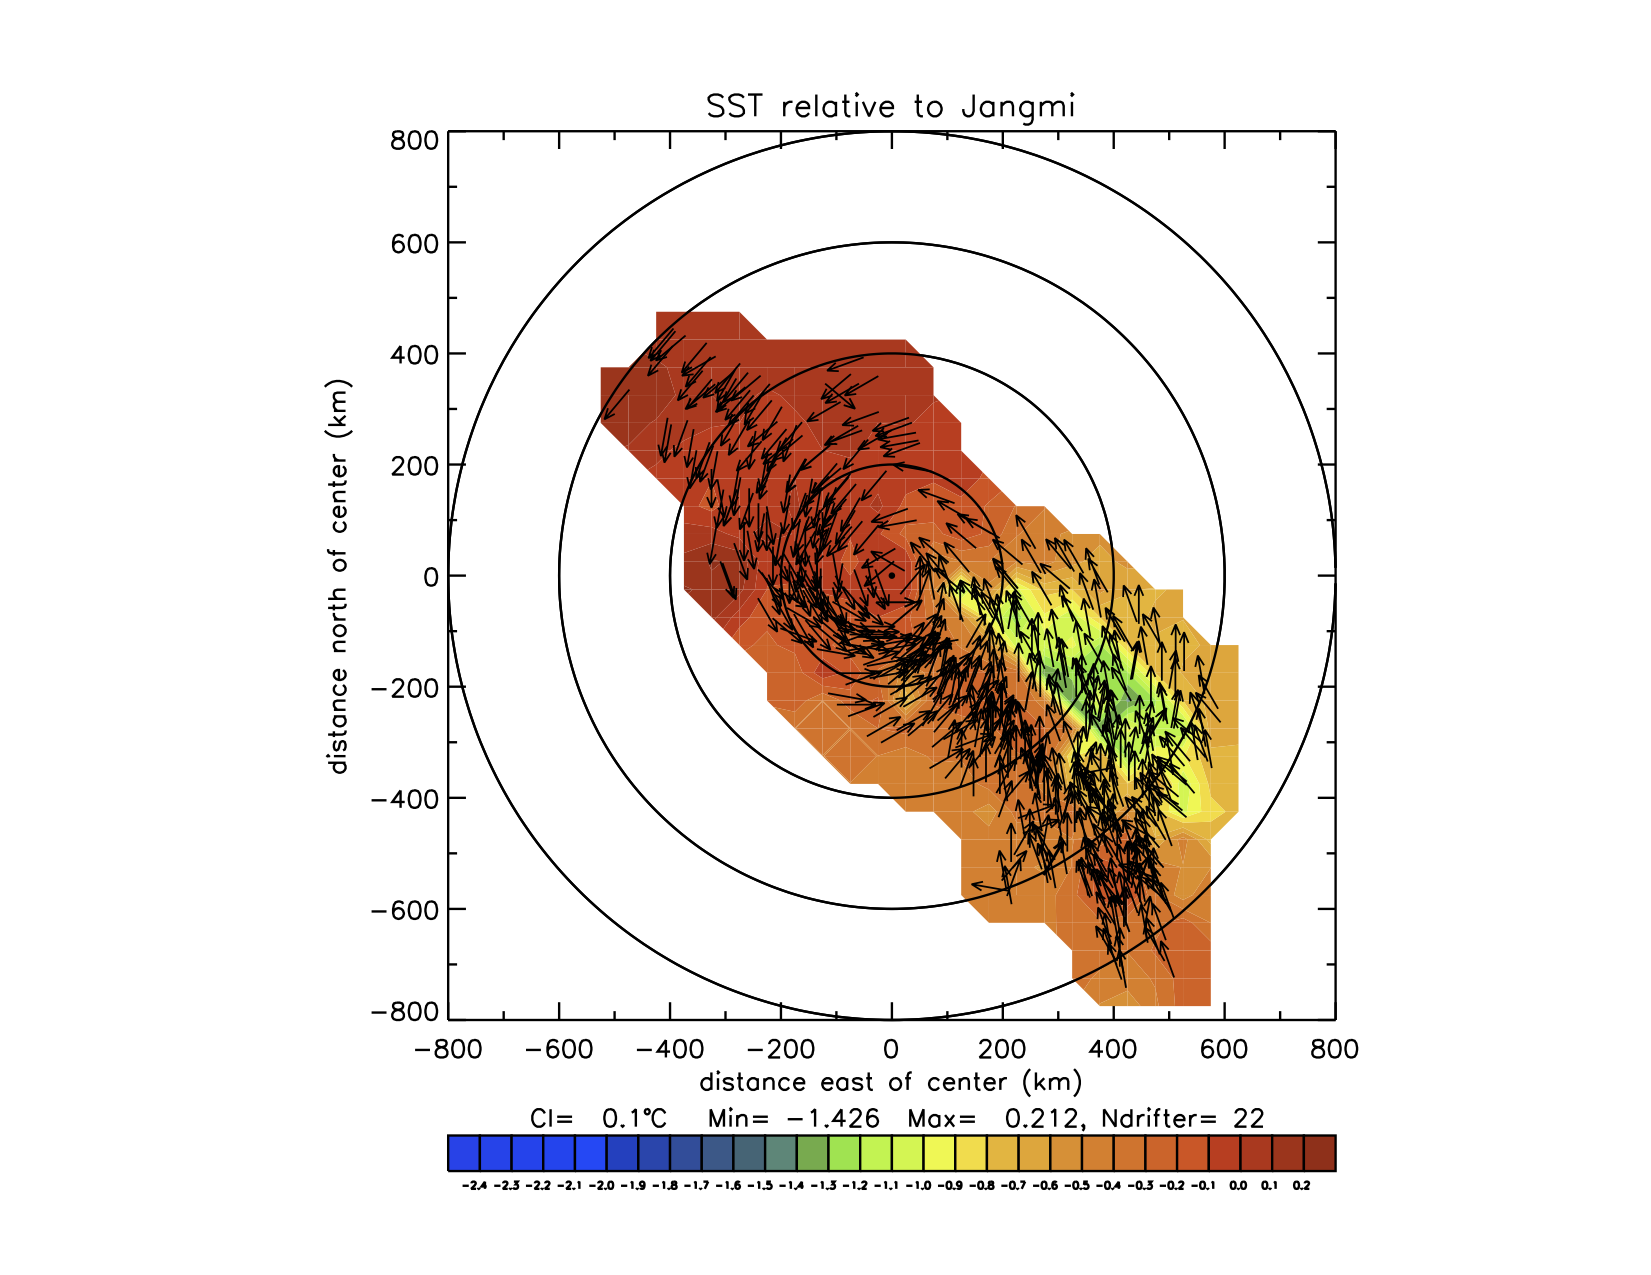
| Pacific | Jangmi | 22 Drifters | ||||
| 2010 | Pacific | Fanapi | 50 Drifters | |||
| Pacific | Malakas | 12 Drifters | ||||
In all following figures, click on the images for enlarged versions of plots.
| Cyclone | Ocean | Time Period | max SST cooling |
| Fabian | Atlantic | 9/04 - 9/06/2003 | -1.5° |
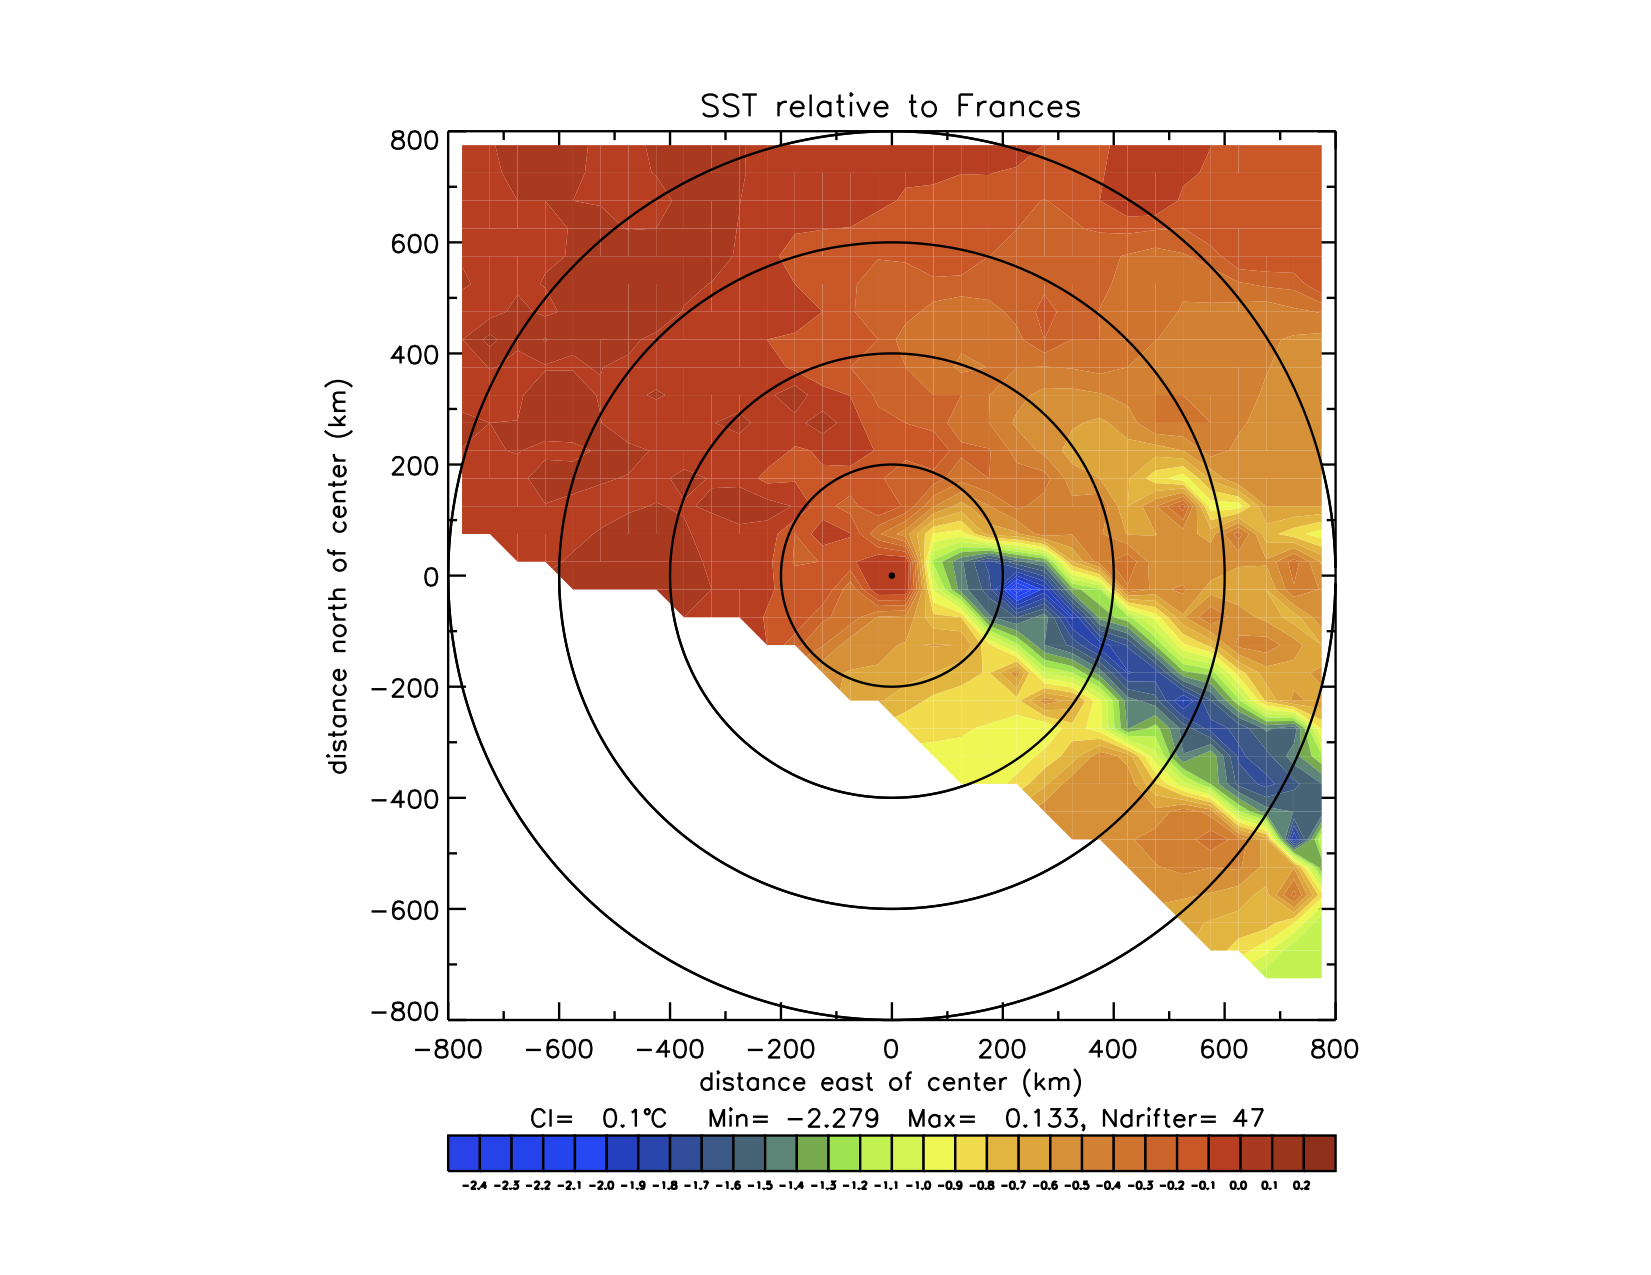
| Frances | Atlantic | 9/01 - 9/05/2004 | -2.3° |
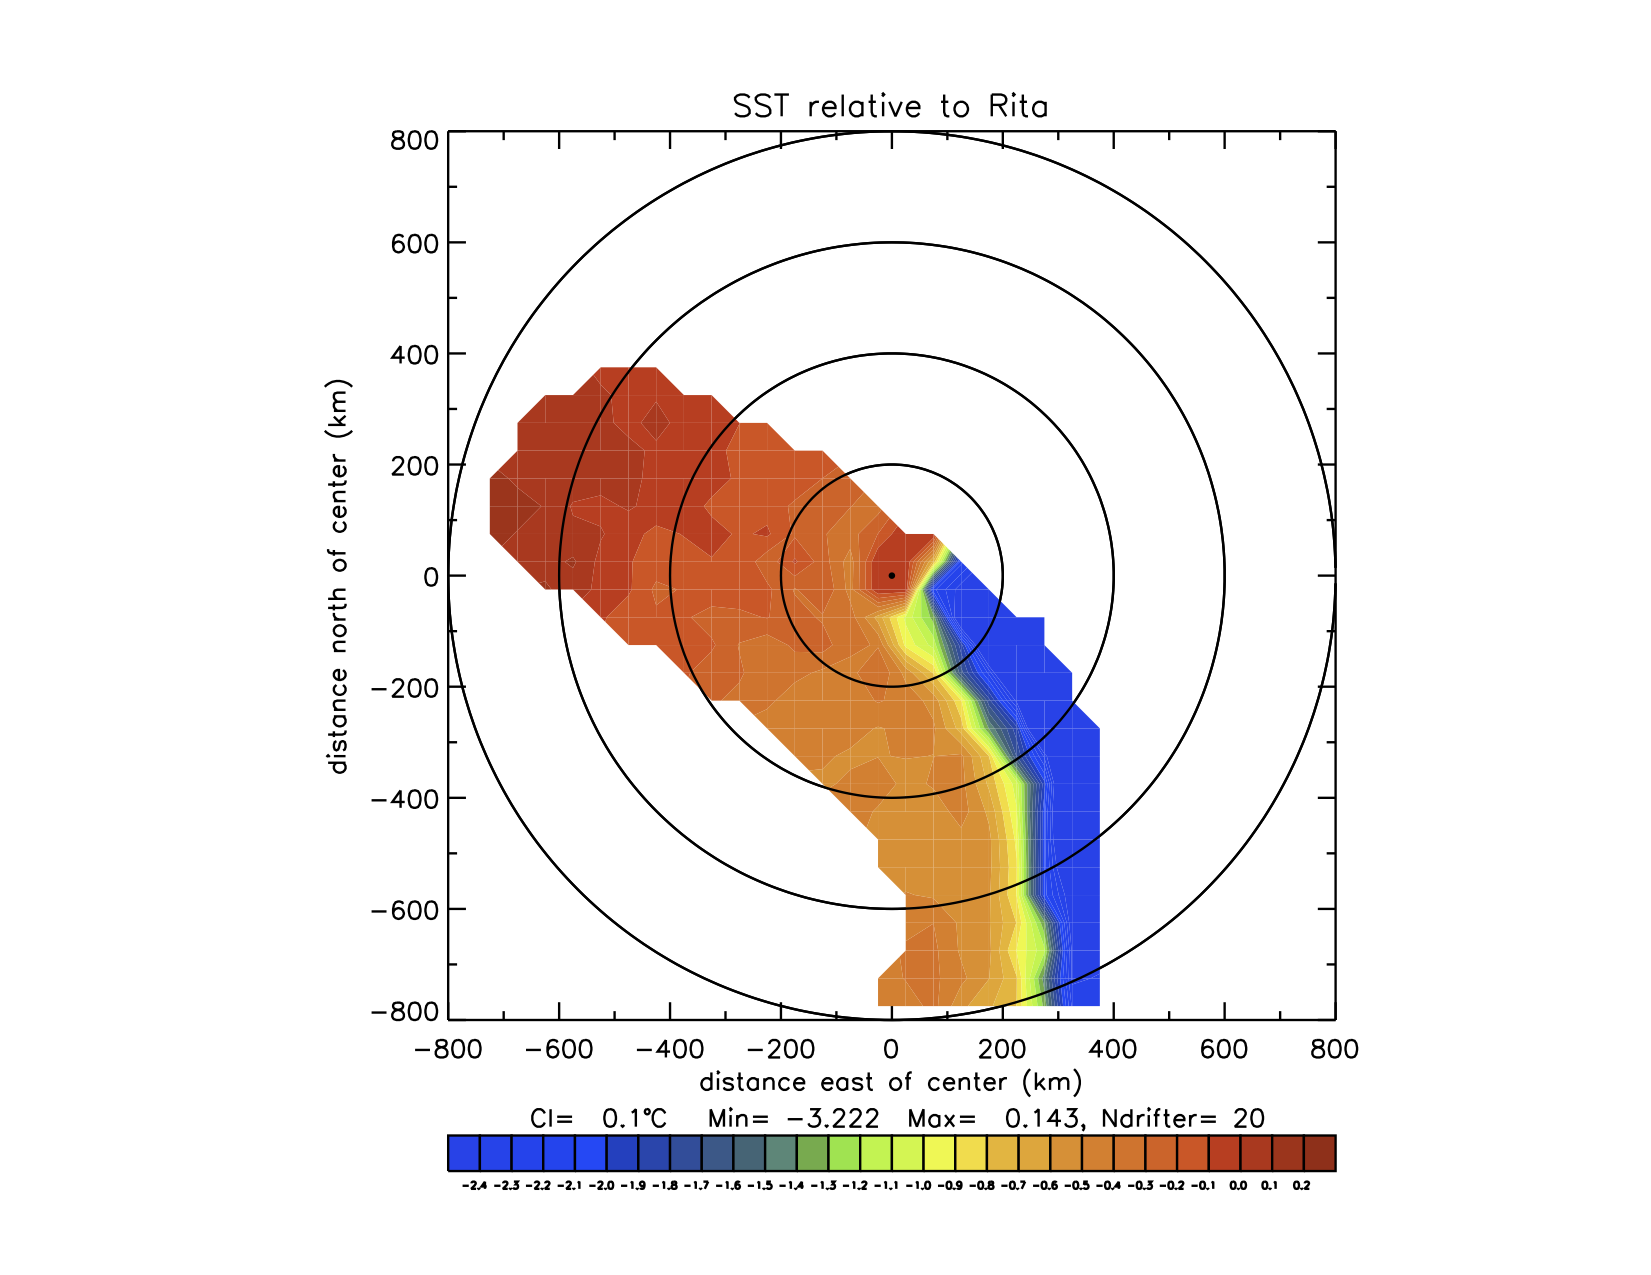
| Rita | Atlantic | 9/21 - 9/25/2005 | -2.3° |
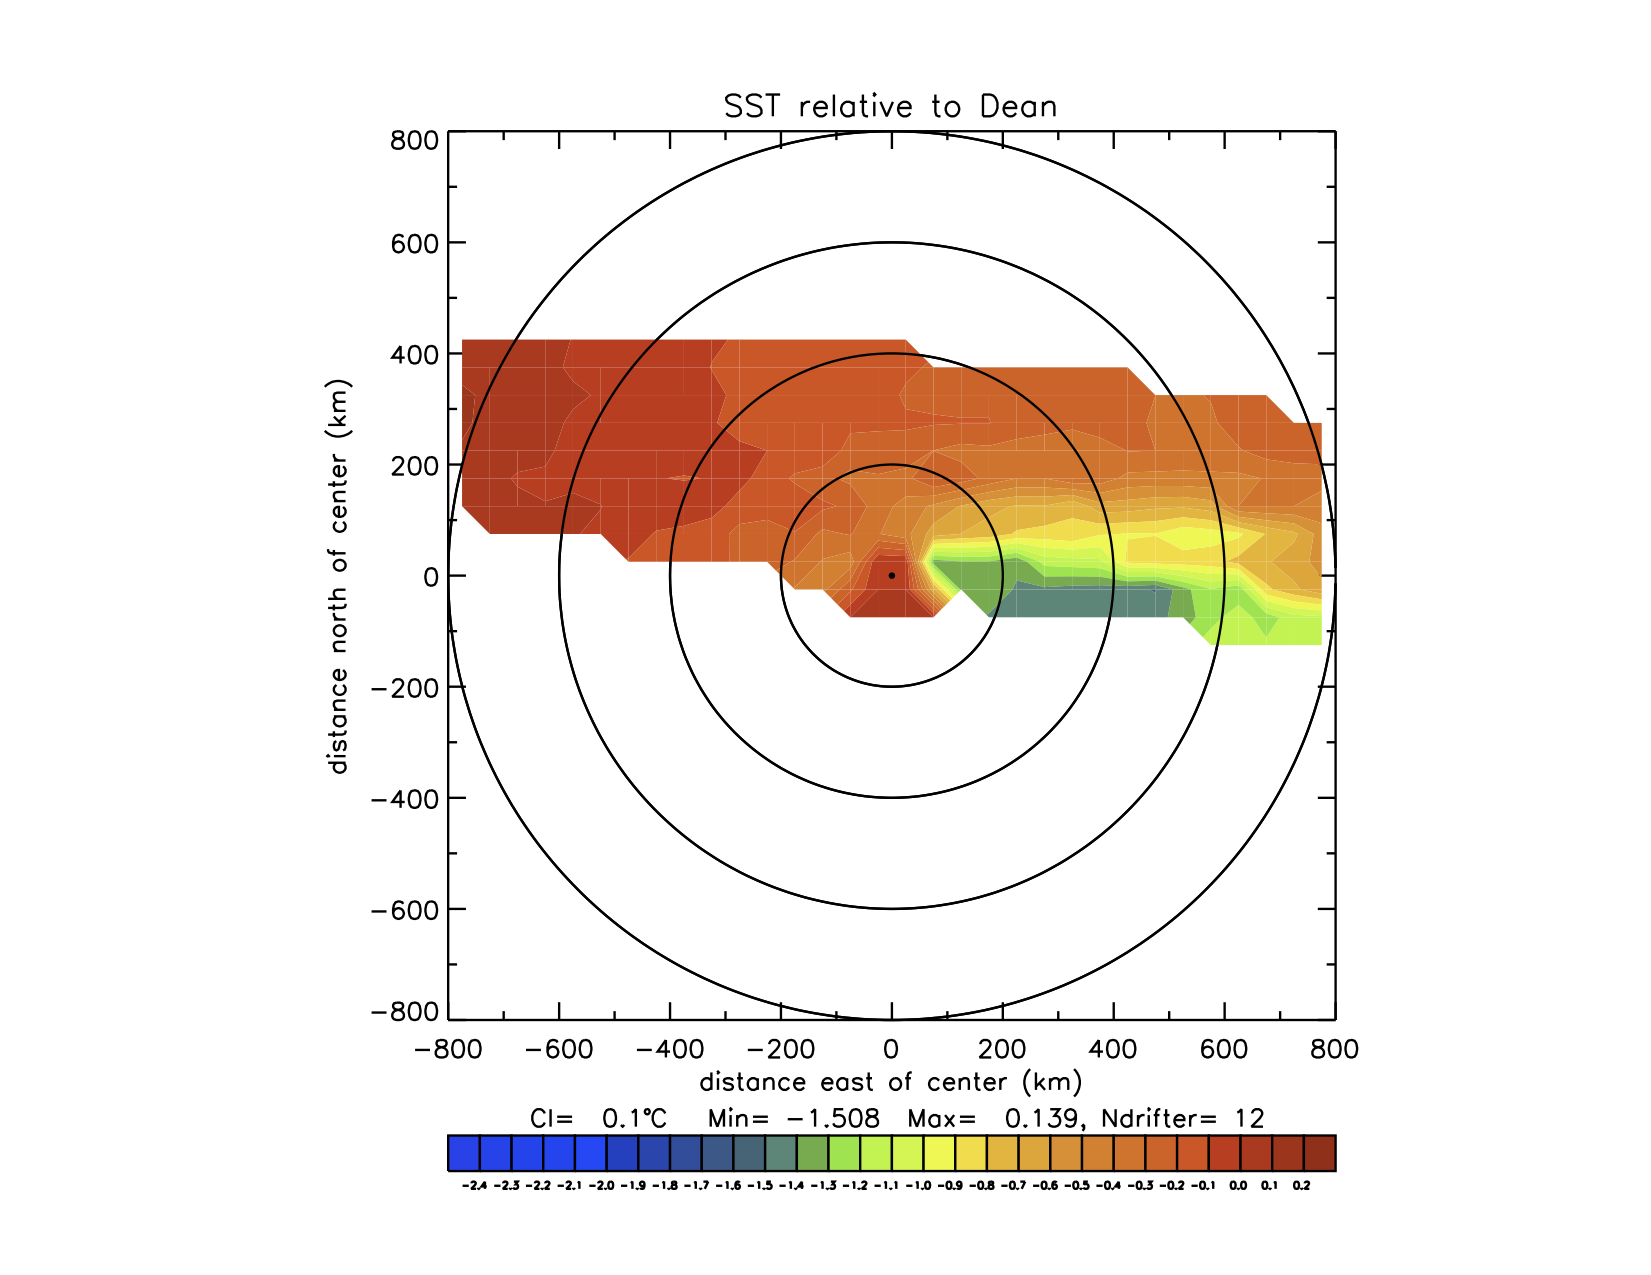
| Dean | Atlantic | 8/19 - 8/21/2007 | -1.5° |
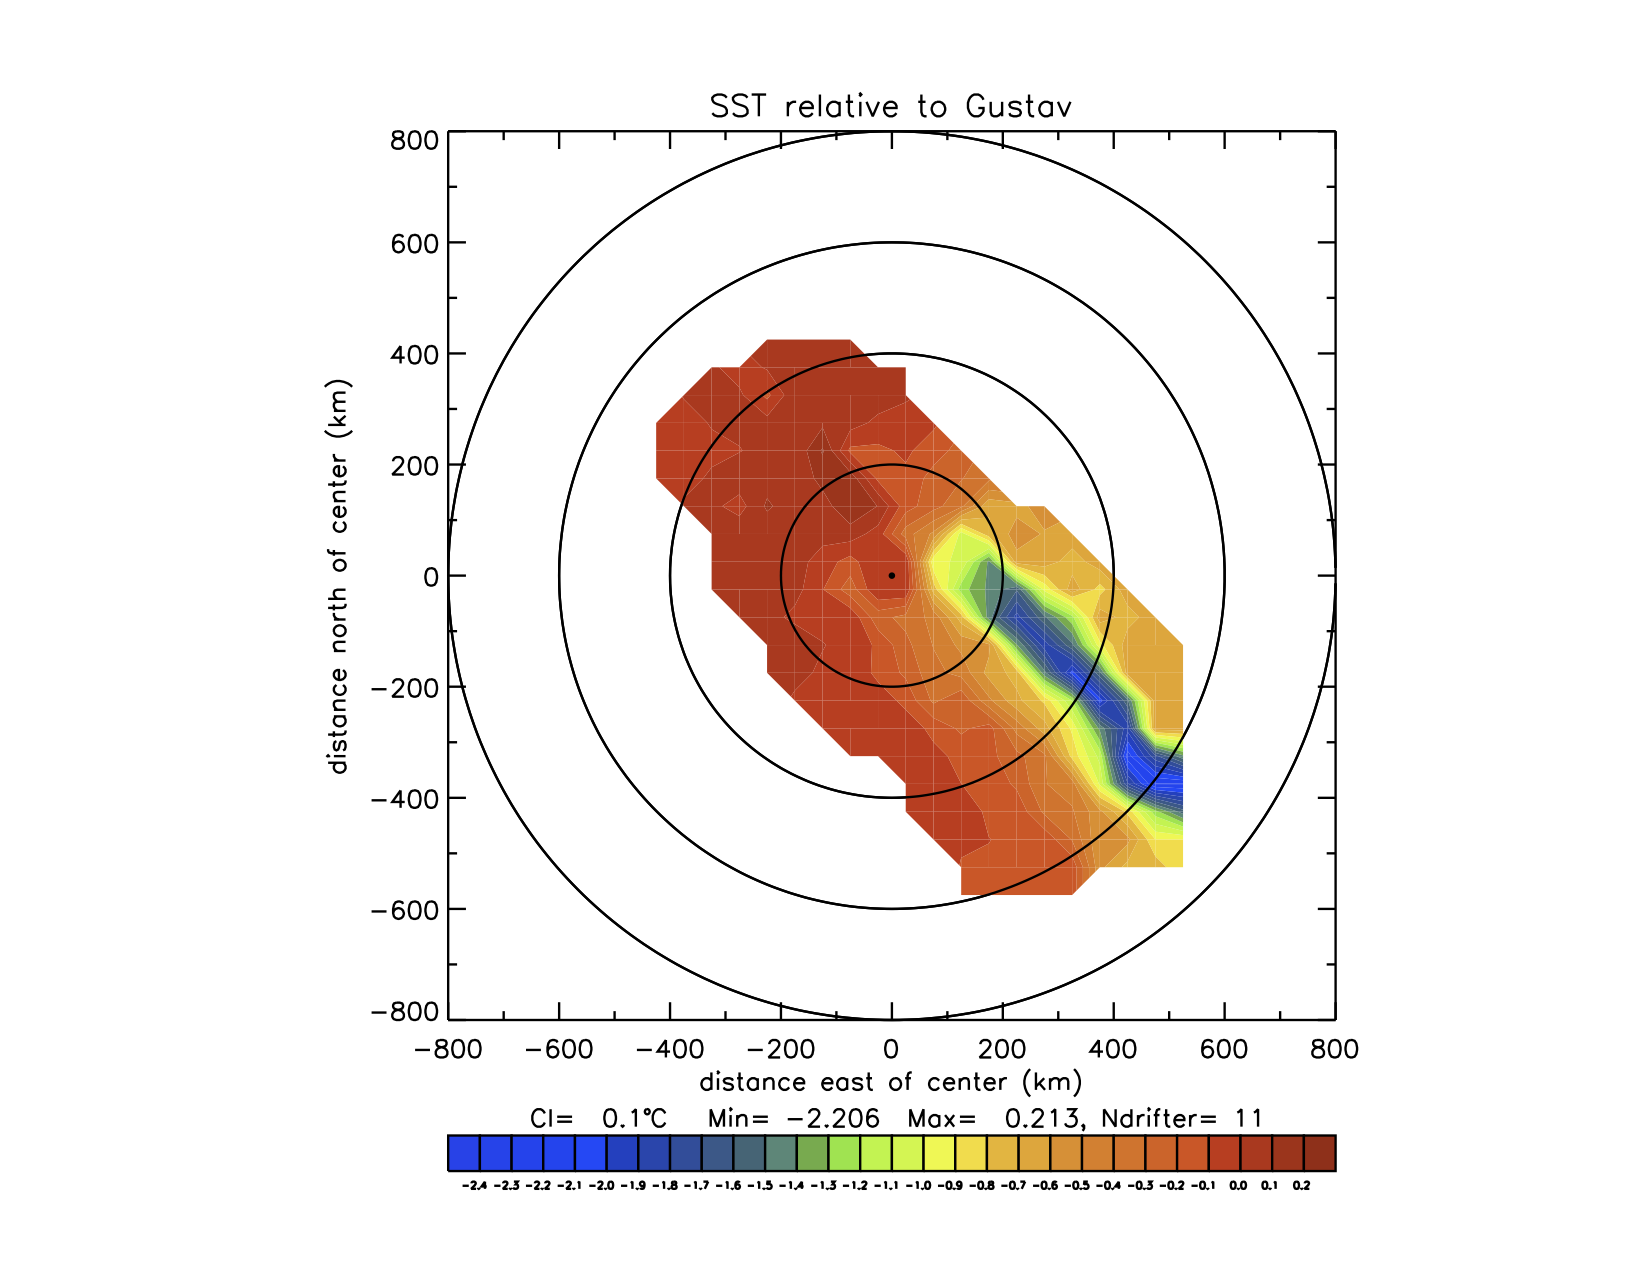
| Gustav | Atlantic | 8/31 - 9/02/2008 | -2.2° |
| Ike | Atlantic | 9/11 - 9/13/2008 | -3.4° |
| Hagupit | Pacific | 9/20 - 9/22/2008 | -1.3° |
| Jangmi | Pacific | 9/26 - 9/28/2008 | -1.4° |
Table 1.1: Maximum SST cooling from drifter observations in eight tropical cyclones.


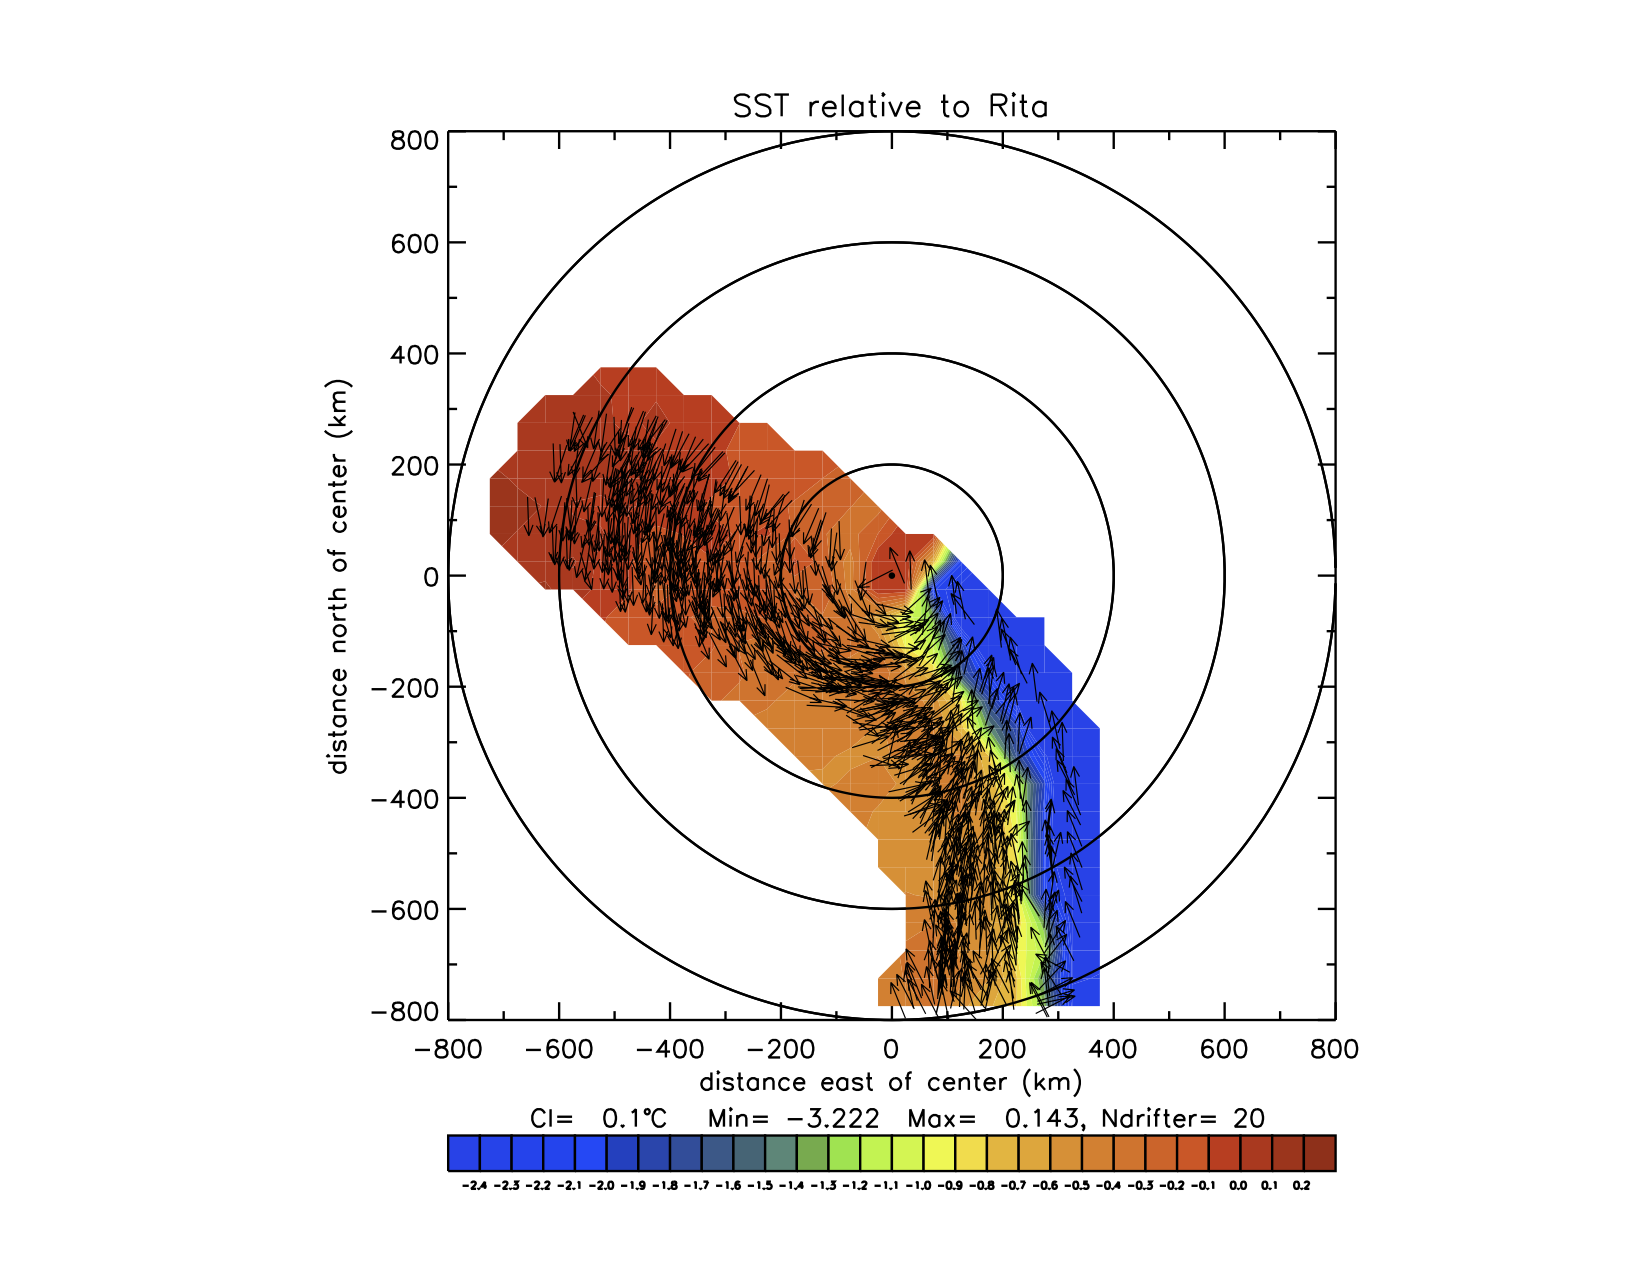
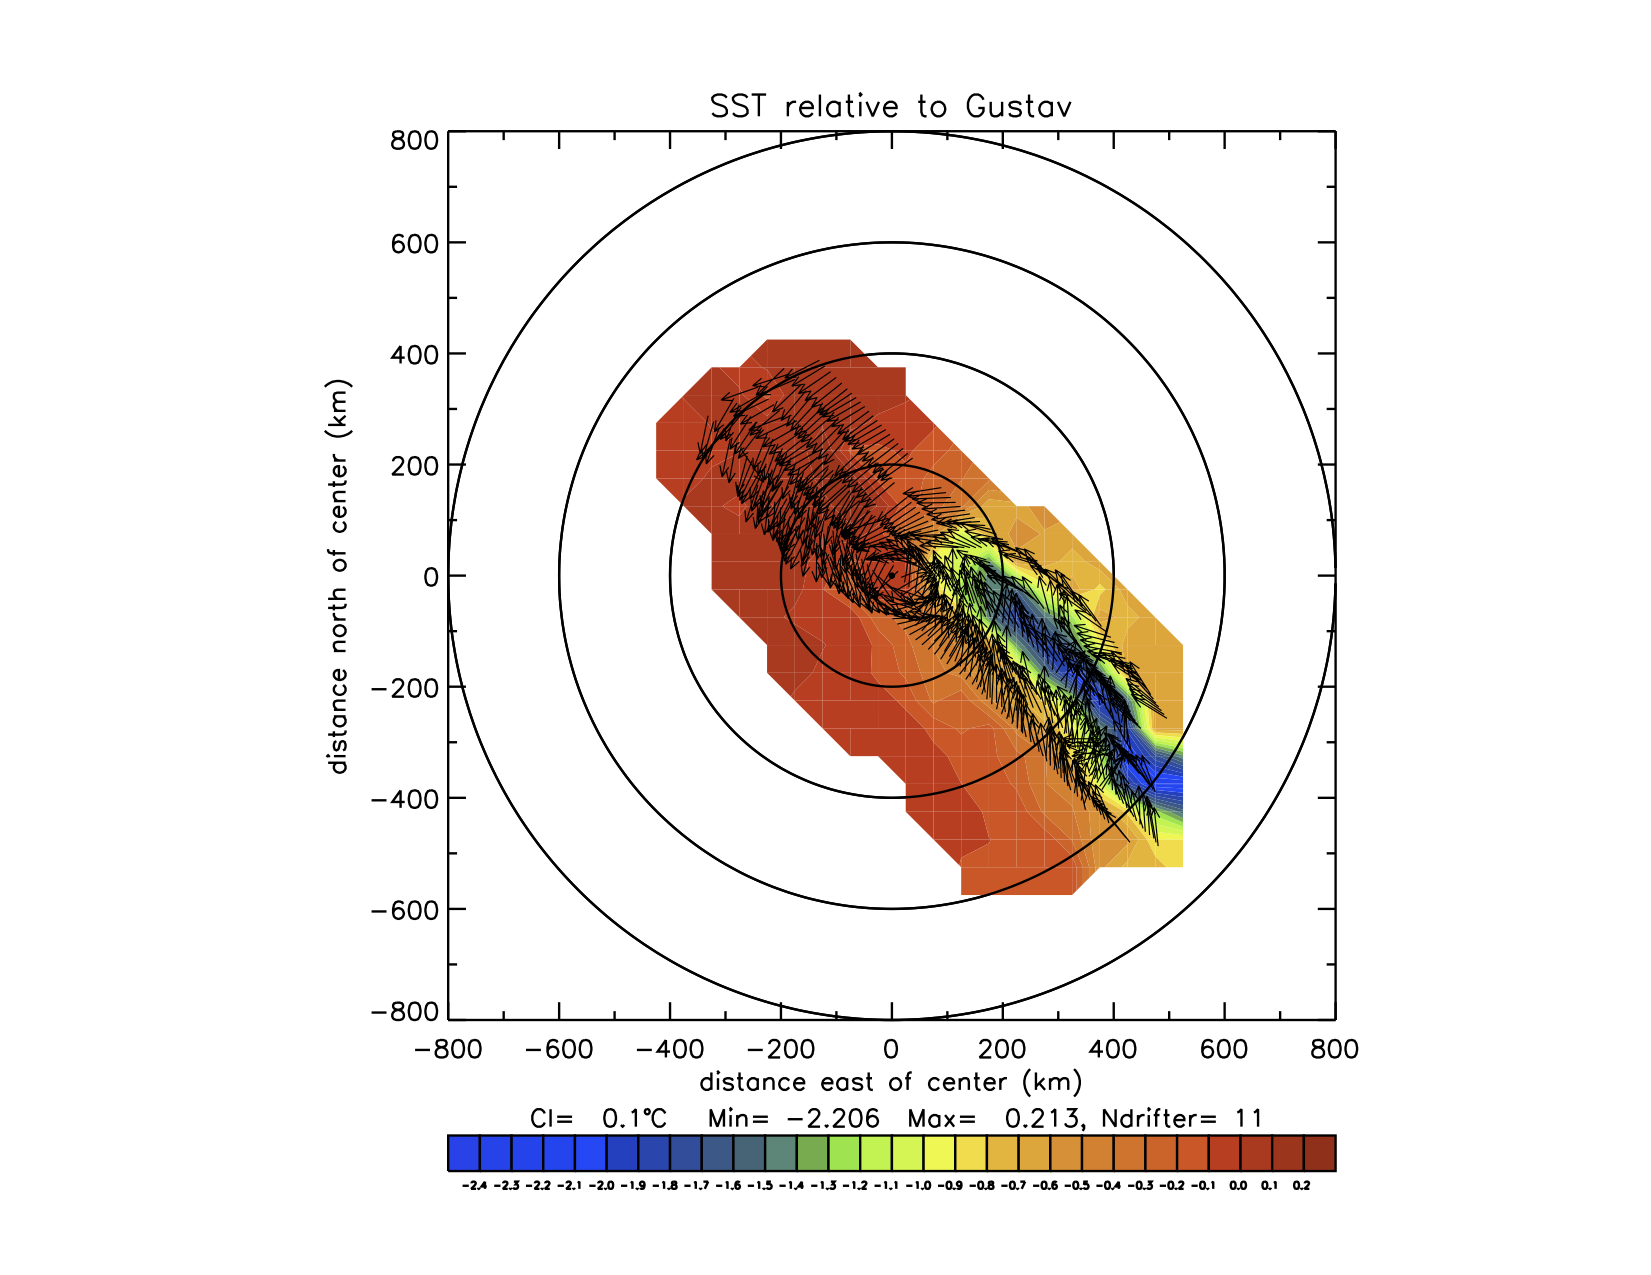
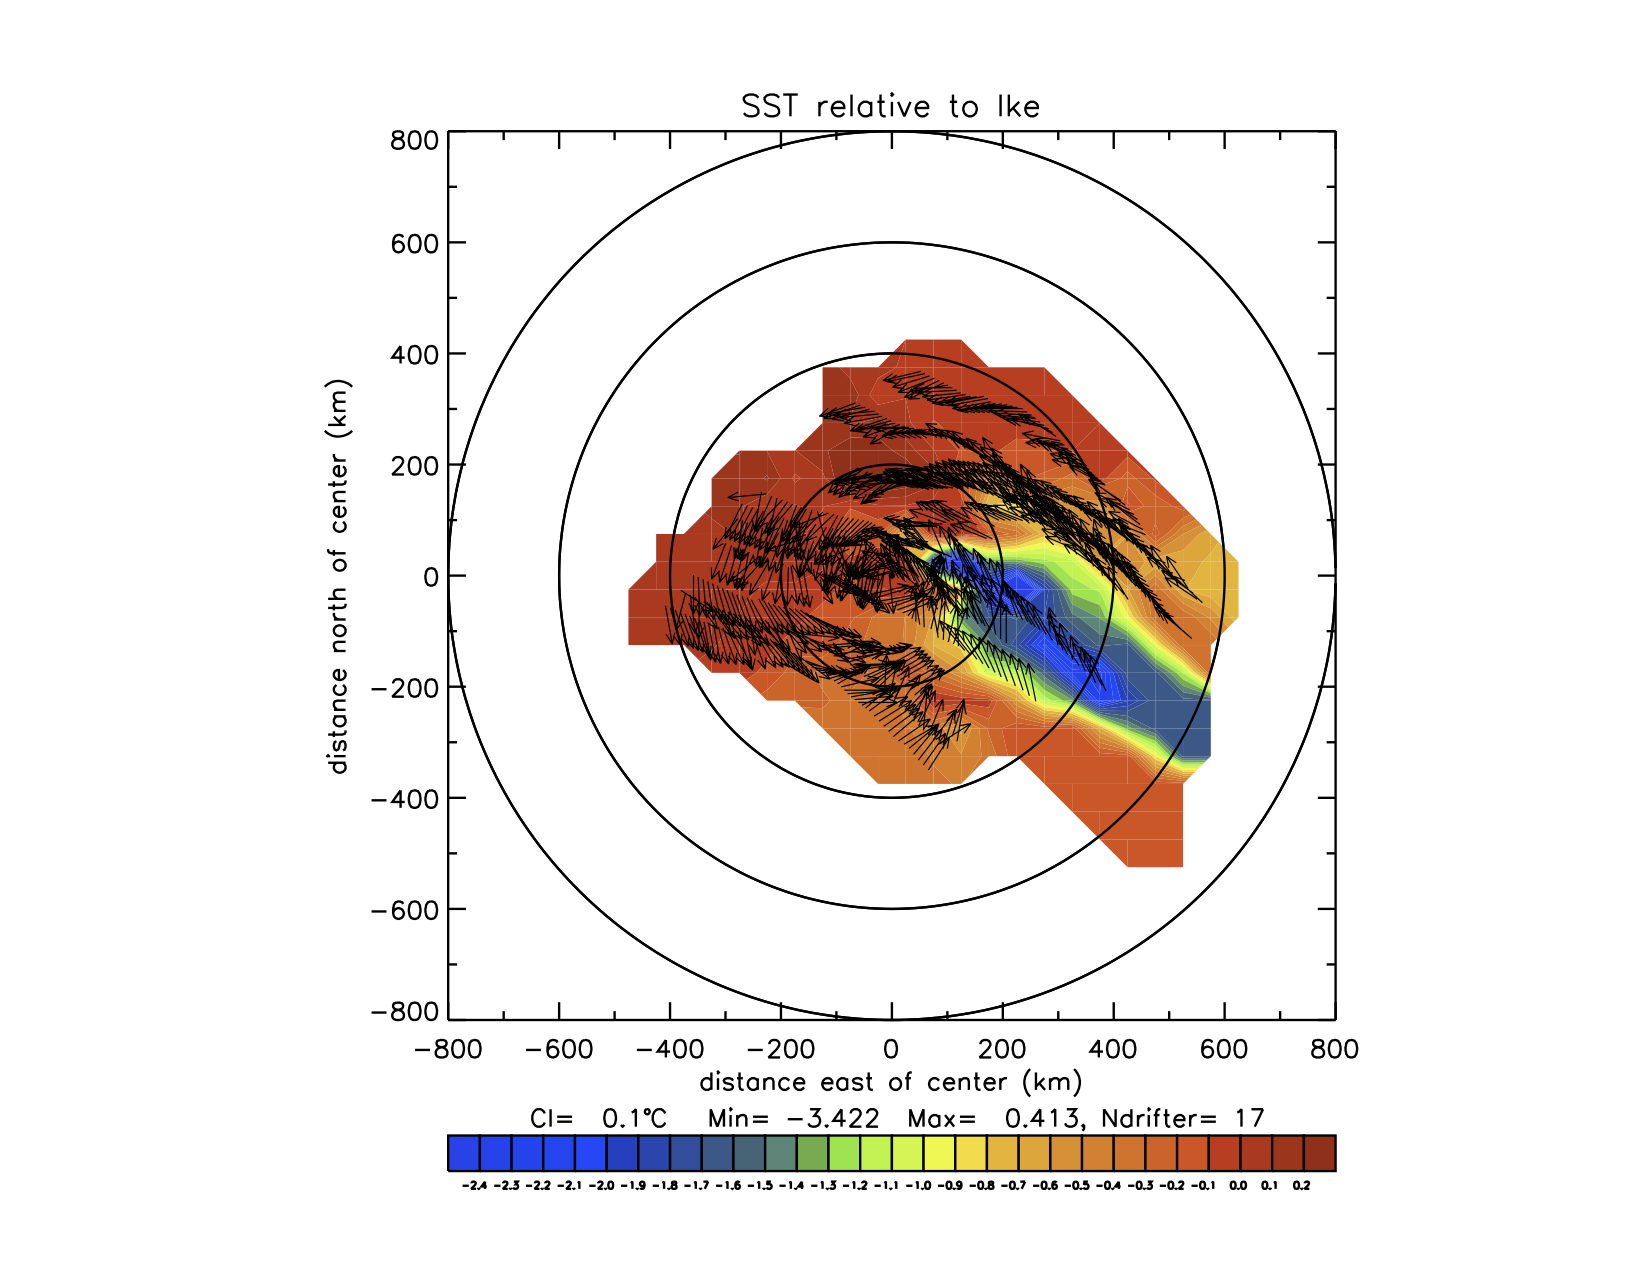
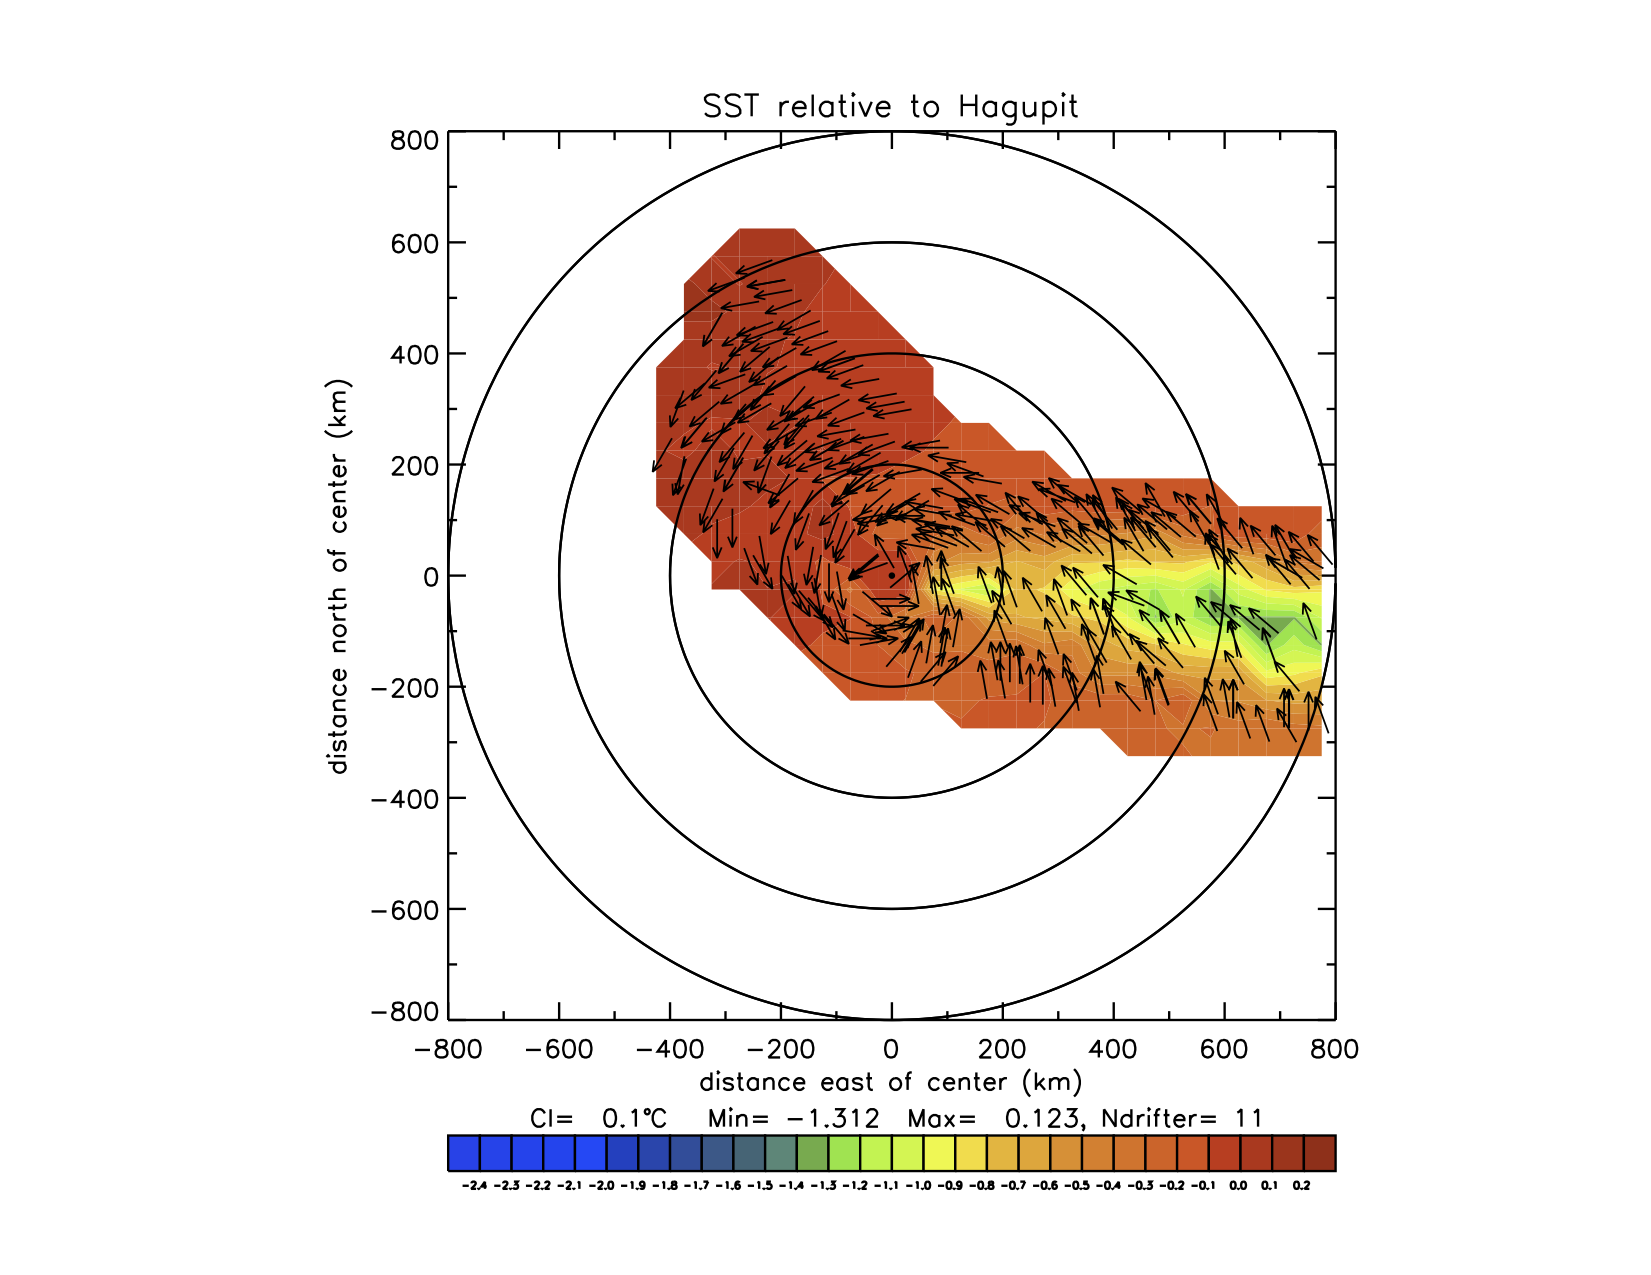
2010 Ocean Sciences Meeting, Portland, Oregon, February, 2010.
The instrumentation of the Minimet buoys is described. The deployments in six hurricanes and two typhoons are summarized. Drifter observations in Rita (2005) are presented in detail: wind direction, SST, and atmospheric pressure. Drifter surface pressure and wind direction observations are compared with dropwindsonde data. Gradient wind balance is derived from drifter pressure observations. The observed surface wind field and its relation to the cold SST wake is shown for both hurricanes and typhoons.
J. Geophys. Res., 114, C04016, doi:10.1029/2008JC005205.
The drag coefficient parameterization of wind stress is investigated for tropical storm conditions using model sensitivity studies. The Massachusetts Institute of Technology (MIT) Ocean General Circulation Model was run in a regional setting with realistic stratification and forcing fields representing Hurricane Frances, which in early September 2004 passed east of the Caribbean Leeward Island chain. The model was forced with a NOAA-HWIND wind speed product after converting it to wind stress using four different drag coefficient parameterizations. Respective model results were tested against in situ measurements of temperature profiles and velocity, available from an array of 22 surface drifters and 12 subsurface floats. Changing the drag coefficient parameterization from one that saturated at a value of 2.3 x 10**-3 to a constant drag coefficient of 1.2 x 10**-3 reduced the standard deviation difference between the simulated minus the measured sea surface temperature change from 0.8°C to 0.3°C. Additionally, the standard deviation in the difference between simulated minus measured high pass filtered 15-m current speed reduced from 15 cm/s to 5 cm/s. The maximum difference in sea surface temperature response when two different turbulent mixing parameterizations were implemented was 0.3°C, i.e., only 11% of the maximum change of sea surface temperature caused by the storm.
Warming of SST in the cool wake of a moving hurricane
J. Geophys. Res., 113, C07010, doi:10.1029/2007JC004393.
Satellite imagery and in situ ocean data show that the cool anomaly of sea surface temperature in the wake of a moving hurricane will disappear over an e-folding time of 5 to 20 days. We have constructed a very simple, local model of the warming process by evaluating the heat budget of the surface layer. This requires (1) an estimate of the heat flux anomaly, δQ, that we presume is associated with the cool anomaly of sea surface temperature (SST), δQ = &lambda δT, where δT is the SST anomaly and for nominal trade wind conditions, &lambda = -65 W/m2/C, and (2) the thickness, D, of the surface layer that absorbs this heat flux anomaly. Evidence from numerical simulations is that D is the trapping depth of the diurnal cycle, and from existing models we estimate D = c1 &tau / Qn**(1/2), where &tau is the wind stress magnitude, Qn is the diurnal maximum (noon) heat flux and c1 is a product of known physical constants. The cool anomaly is then a decaying exponential, δT &prop δT0 exp(-t/Γ), where δT0 is the spatially dependent cooling amplitude, and the e-folding time is &Gamma = c2 &tau / &lambda Qn**(1/2), with c2 also known. This solution agrees reasonably well with the observed e-folding time of cooling in the wake of Hurricane Fabian (2003), approximately 5 days, and in the wake of Hurricane Frances (2004), very roughly 20 days. The latter e-folding time was greater (i.e., the normalized warming rate was slower) primarily because winds were fresher and secondarily because cloud cover was greater. It is notable that the e-folding time in this solution depends upon two properties of the surface heat flux, the slowly varying heat flux anomaly and the diurnal variation of the heat flux, here represented by the noon maximum, Qn .
Cold wake of Hurricane Frances
Geophys. Res. Lett., 34, L15609, doi:10.1029/2007GL030160.
An array of instruments air-deployed ahead of Hurricane Frances measured the three-dimensional, time dependent response of the ocean to this strong (60 m/s) storm. Sea surface temperature cooled by up to 2.2°C with the greatest cooling occurring in a 50-km-wide band centered 60-85 km to the right of the track. The cooling was almost entirely due to vertical mixing, not air-sea heat fluxes. Currents of up to 1.6 m/s and thermocline displacements of up to 50 m dispersed as near-inertial internal waves. The heat in excess of 26°C, decreased behind the storm due primarily to horizontal advection of heat away from the storm track, with a small contribution from mixing across the 26°C isotherm. SST cooling under the storm core (0.4°C) produced a 16% decrease in air-sea heat flux implying an approximately 5 m/s reduction in peak winds.
J. Atmos. Oceanic Technol., 20, 513-533.
Observations of the surface wind speed and direction in the Labrador Sea for the period October 1996–May 1997 were obtained by the NASA scatterometer (NSCAT), and by 21 newly developed Minimet drifting buoys. Minimet wind speeds are inferred, hourly, from observations of acoustic pressure in the Wind-Speed Observation Through Ambient Noise (WOTAN) technology. Wind directions are inferred from a direction histogram, also accumulated hourly, as determined by the orientation of a wind vane attached to the surface floatation. Effective temporal averaging of acoustic pressure (20 min), and the interval over which the direction histogram is accumulated (160 s), are shown to be consistent with low-pass filtering to preserve mesoscale time- and space- scale signals in the surface wind. Minimet wind speed and direction retrievals in the Labrador Sea were calibrated with collocated NSCAT data. The NSCAT calibrations extend over the full field lifetimes of each Minimet (90 days on average). Wind speed variabilities of O(5 m/s) and wind direction variabilities of O(40°) are evident on timescales of one to several hours in Minimet time series. Wind speed and direction rms differences versus spatial separation comparisons (from 0 to 400 km) for the NSCAT and Minimet records demonstrate similar rms differences in wind speed as a function of spatial separation, but O(20°) larger rms differences in Minimet direction. These differences are consistent with spatial smoothing effects in the median filter step for wind direction retrievals within the NSCAT swath. Zonal and meridional surface wind components are constructed from the calibrated Minimet wind speed and direction dataset. Rms differences versus spatial separation for these components are used to estimate mesoscale spatial correlation length scales of 250 and 290 km in the zonal and meridional directions, respectively.
When using data from this website, please acknowledge us in your publications with text such as: Data provided by UCSD under sponsorship of ONR, NOAA, and NSF: "Targeted Atmosphere Ocean Observations from Tropical Cyclones": http://tao-tc.ucsd.edu.